Gateway Service Manager User Manual
1. User Management
1. Registration and login
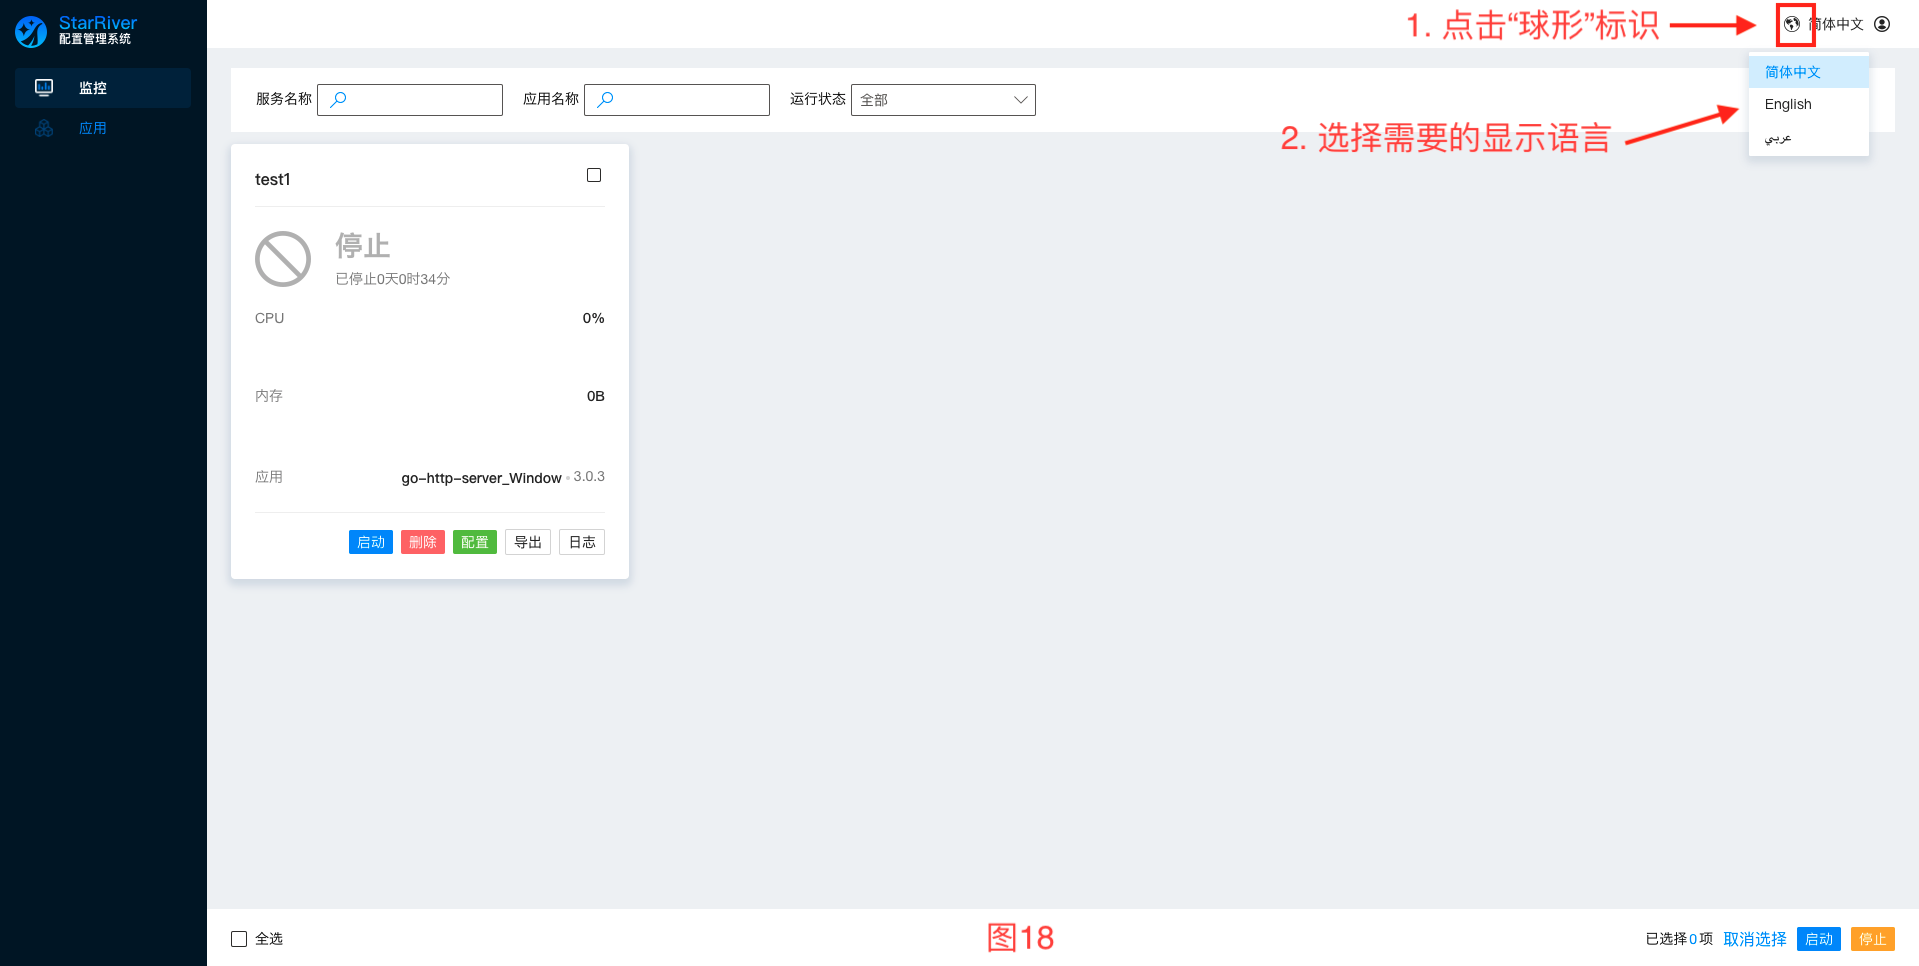
After the project deployment is completed, enter the corresponding address in the browser. For example, assuming that the gateway service manager host IP is 192.168.1.100, go to https://192.168.1.100:13333. You can see a page similar to Figure 1. Set the password according to the indicator in the figure, then click the "Save and Continue" button, and enter the login page, as shown in Figure 2.
Notes:
- Passwords should follow the rules:
- Length within 6 to 18 characters.
- Lowercase letters [A-Z] and uppercase letters [A-Z] can be used.
- Numbers [0-9] can be used.
- Underline [_] can be used.
- Figure 1 gage only appears when registering the password for the first time. From the second time, the project will enter the login page directly.
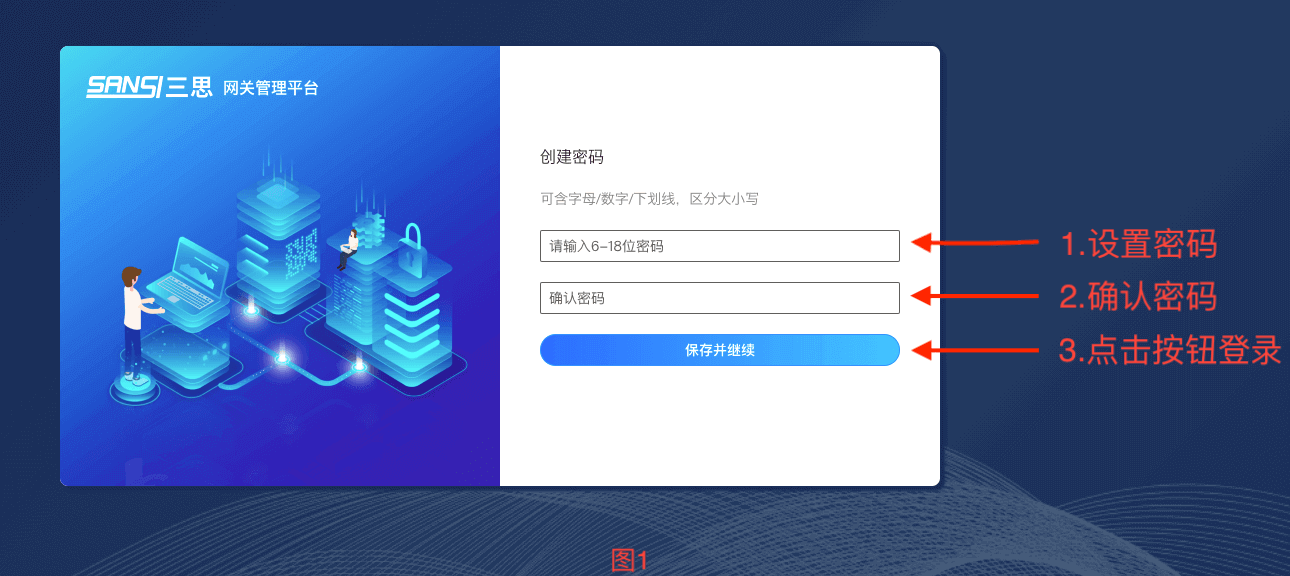
Enter the registered password, and click the login button to enter the project monitoring page.
2. Change password
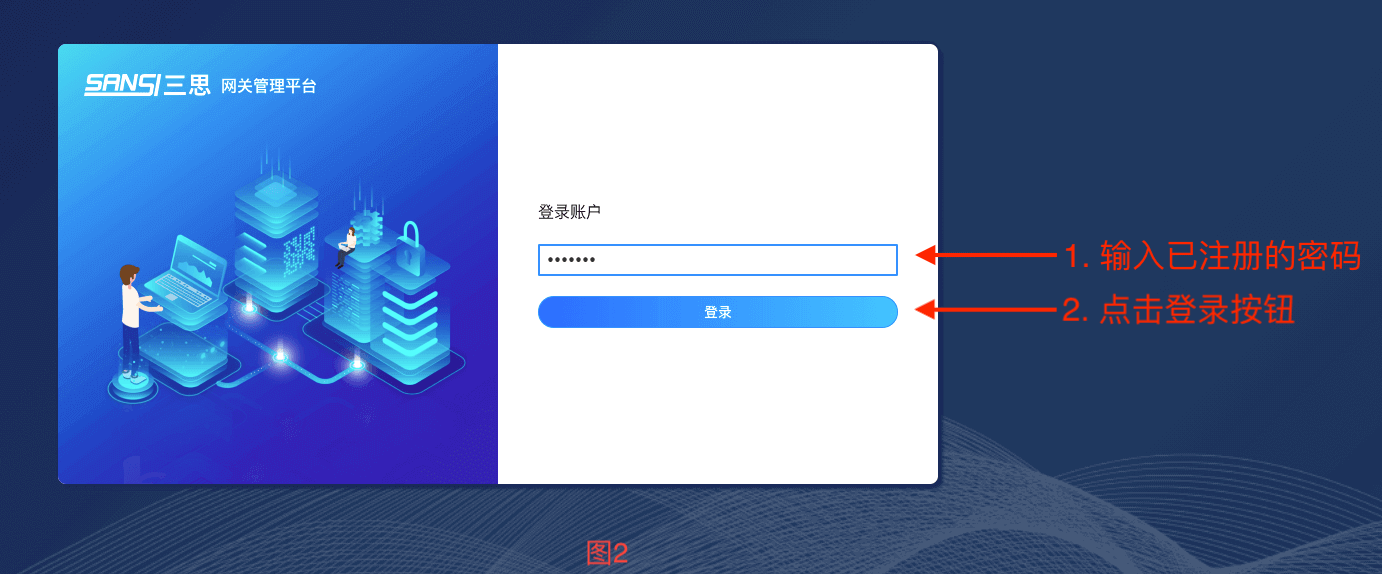
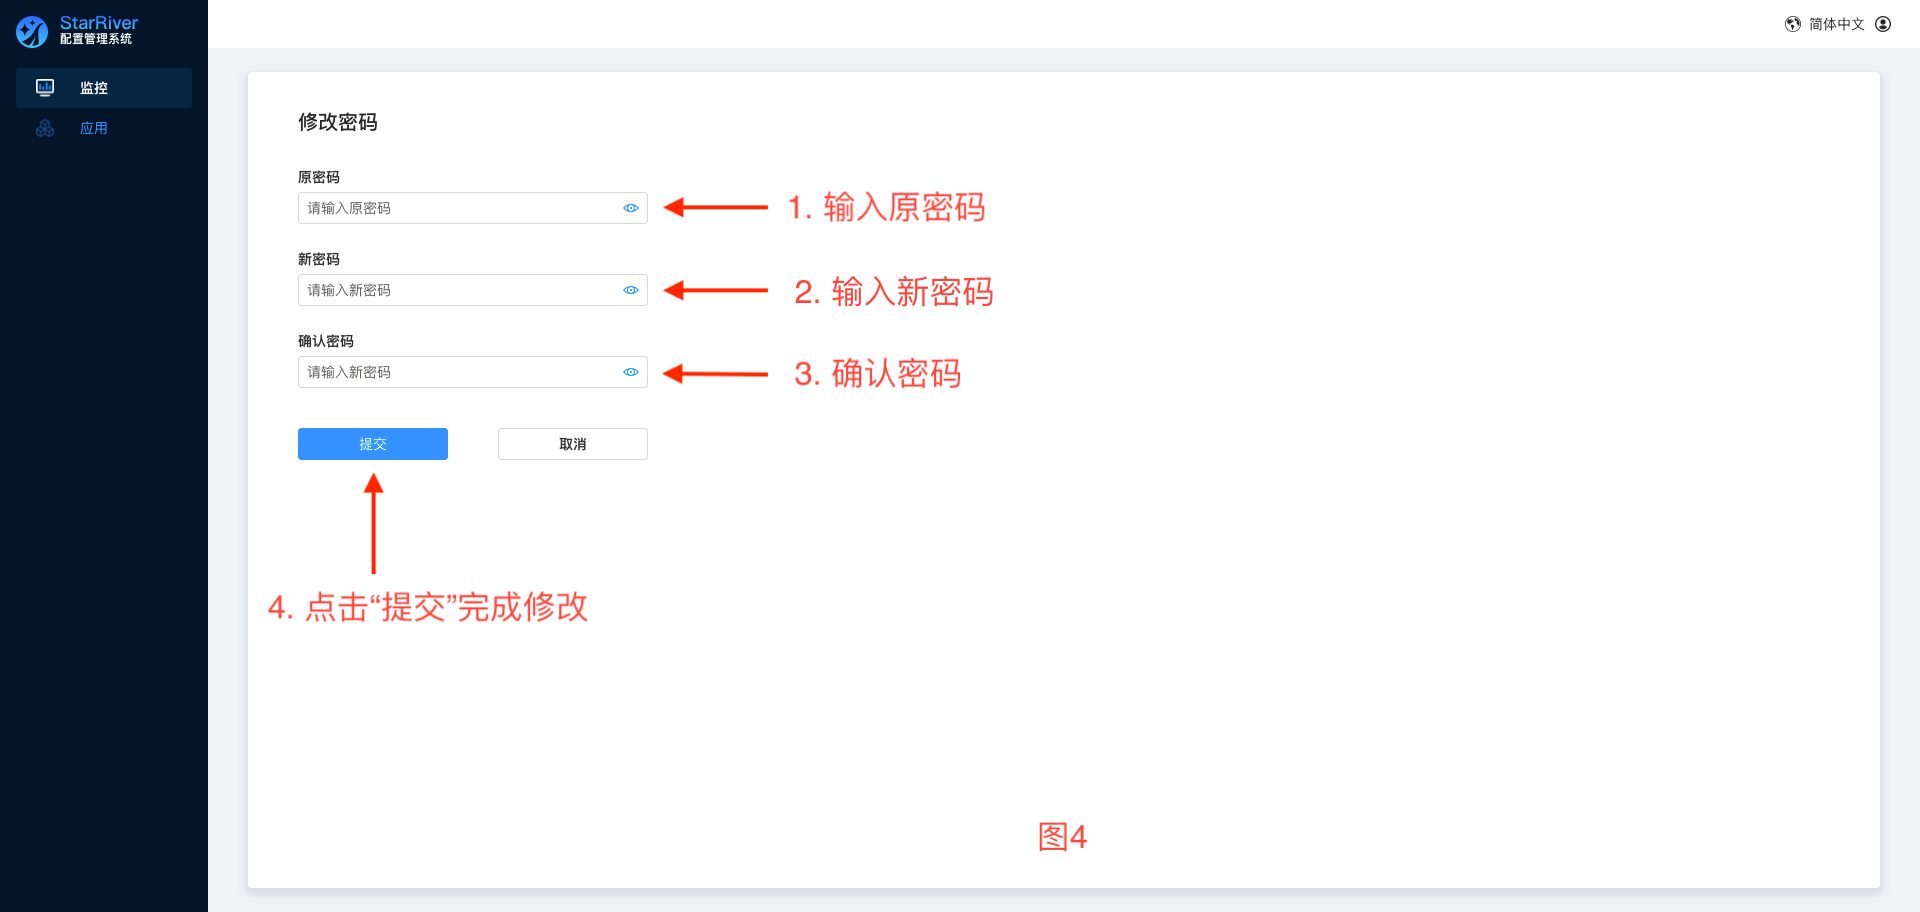
After the user logs in, click the "User" logo in the upper right corner (as shown in the upper right corner of Figure 3), and then click the "Change Password" button to enter a page like Figure 4. You can follow Figure 4 prompts to change the password.
3. Log out
After the user logs in, click the "User" logo in the upper right corner (as shown in the upper right corner of Figure 3), and then click the "Log out" button.
2. Add an application
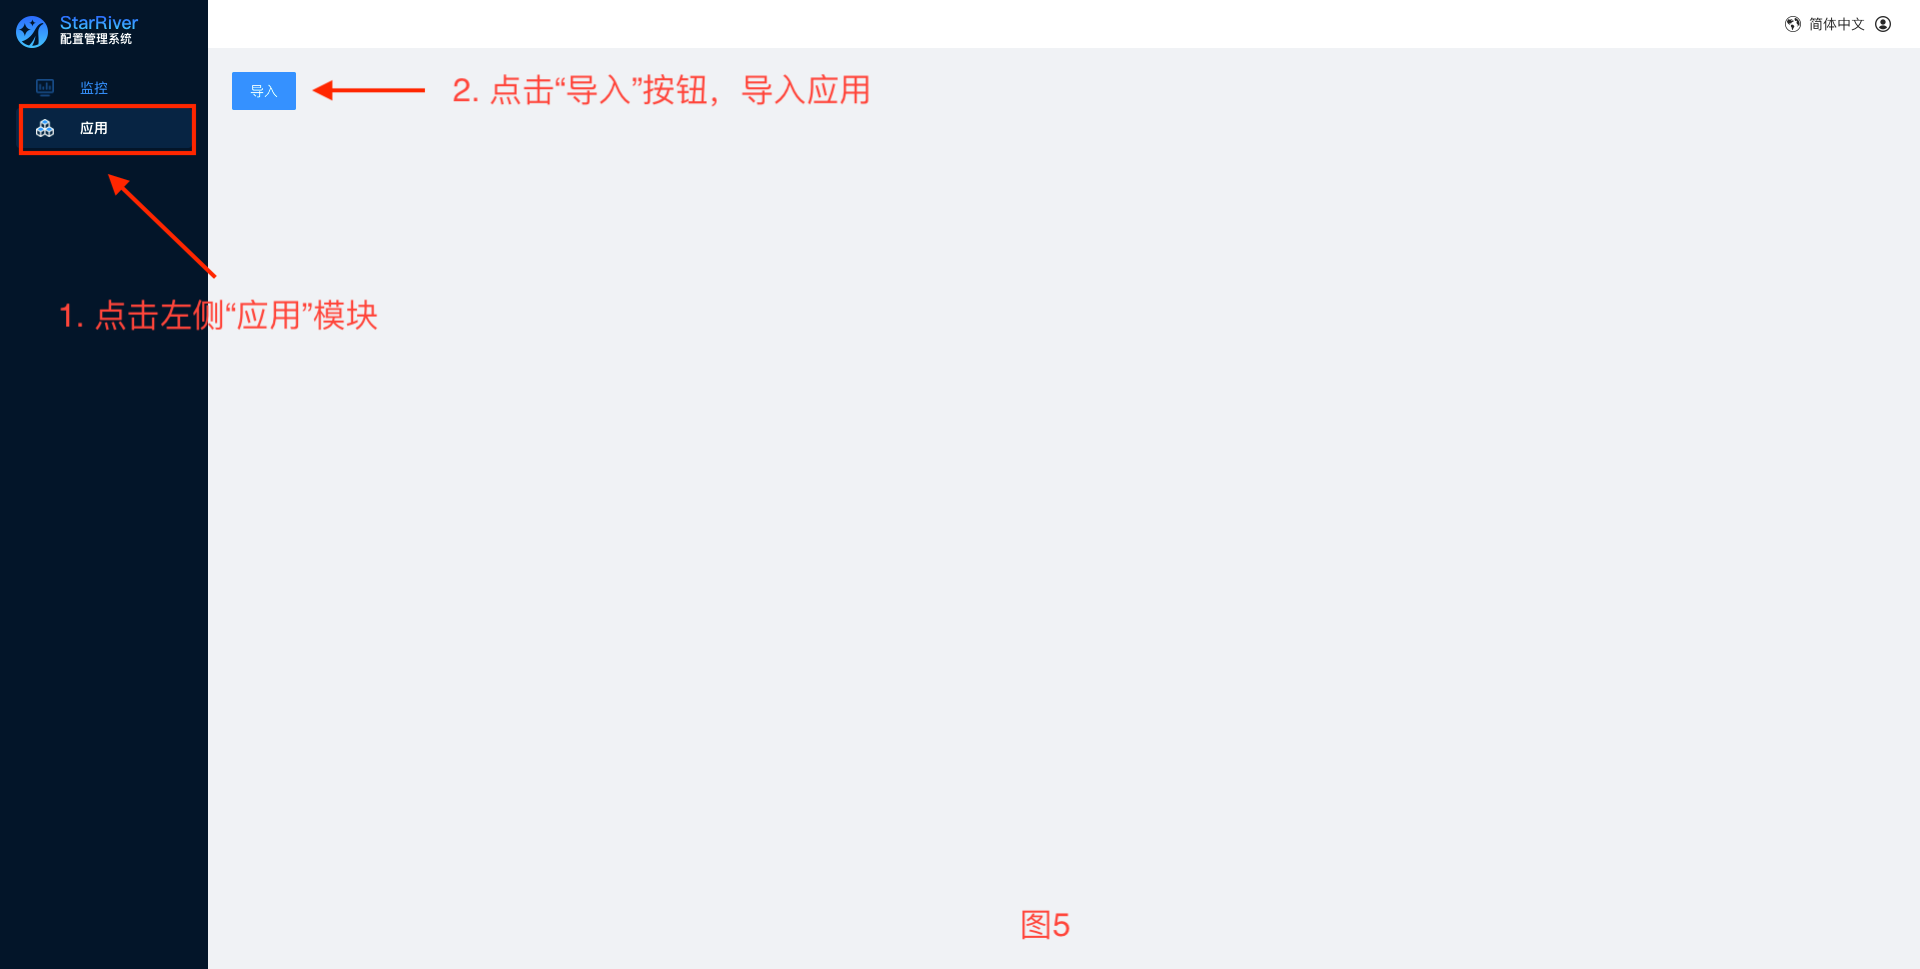
After the user logs in, click the "application" module on the left to enter the application added page (as shown in Figure 5), click the "Import button",
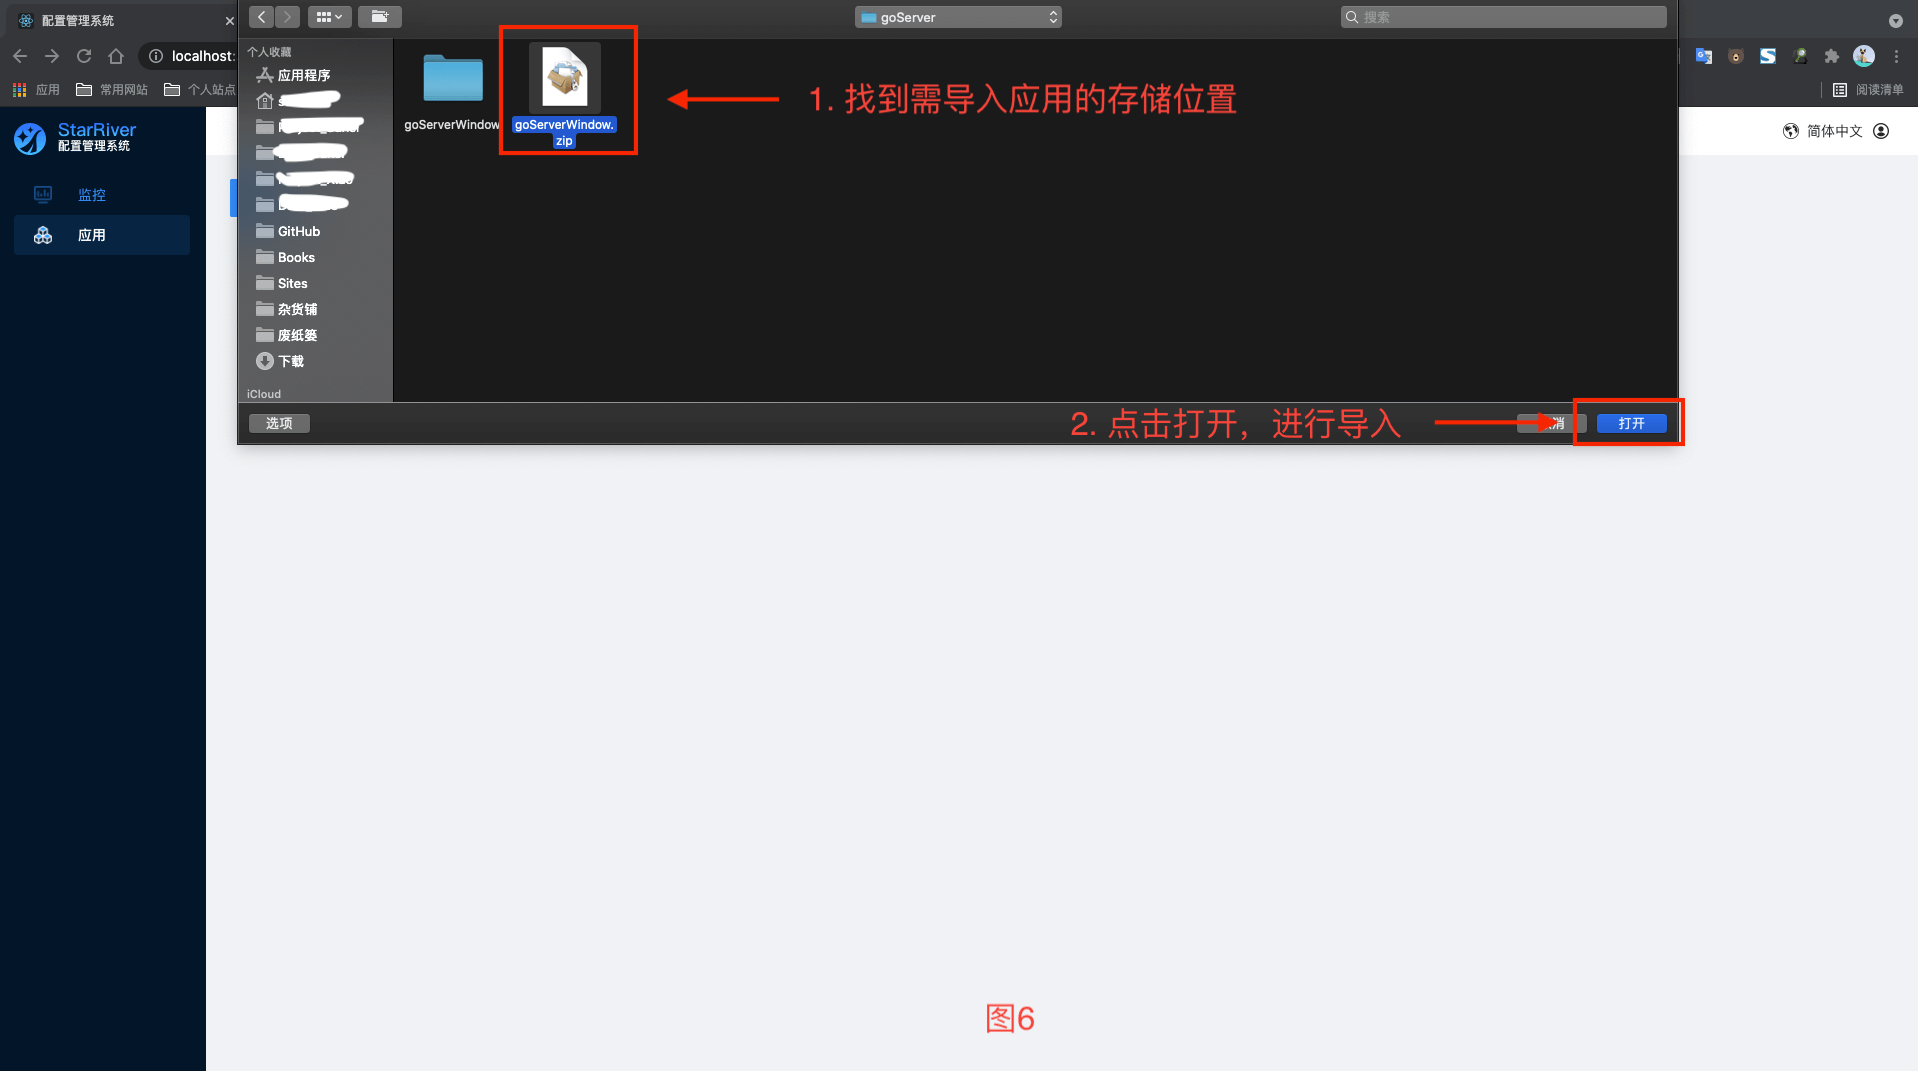
The introduction of this document application takes MAC as an example. As shown in Figure 6 below, the introduction steps of Windows are consistent with this.
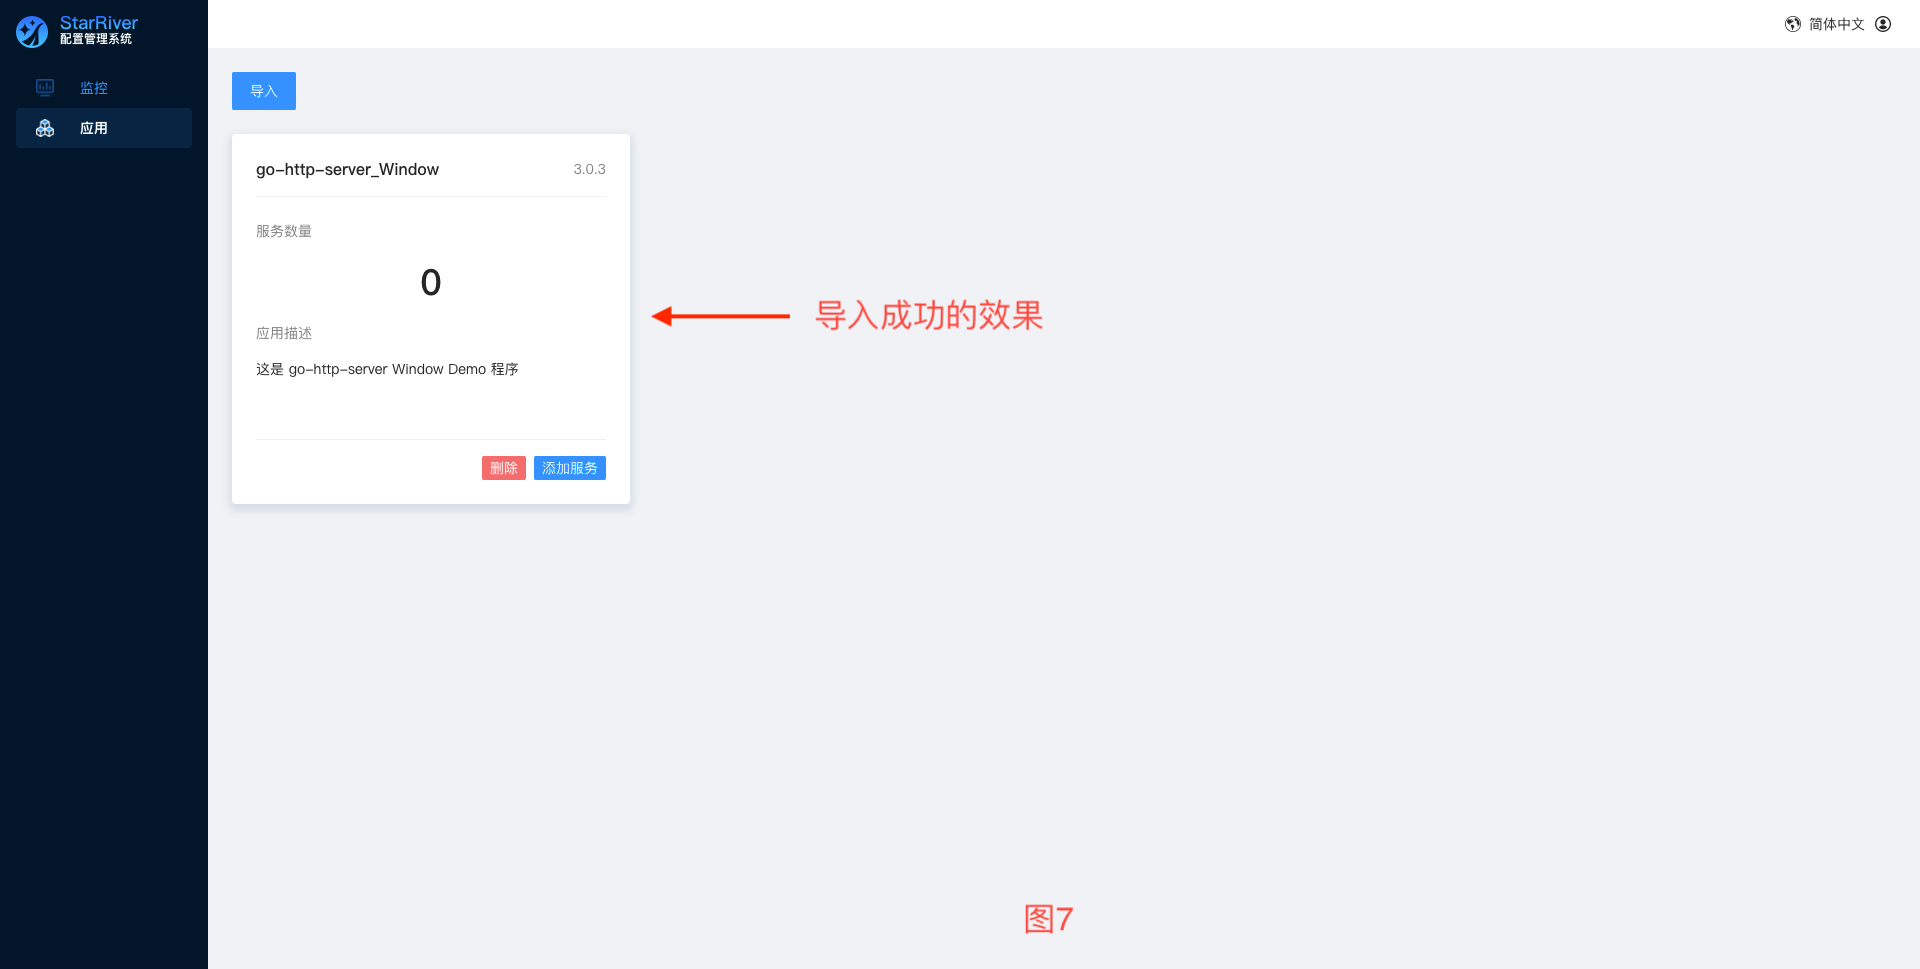
After the application is successfully introduced, the result is shown in Figure 7 below.
3. Add a Monitored Service
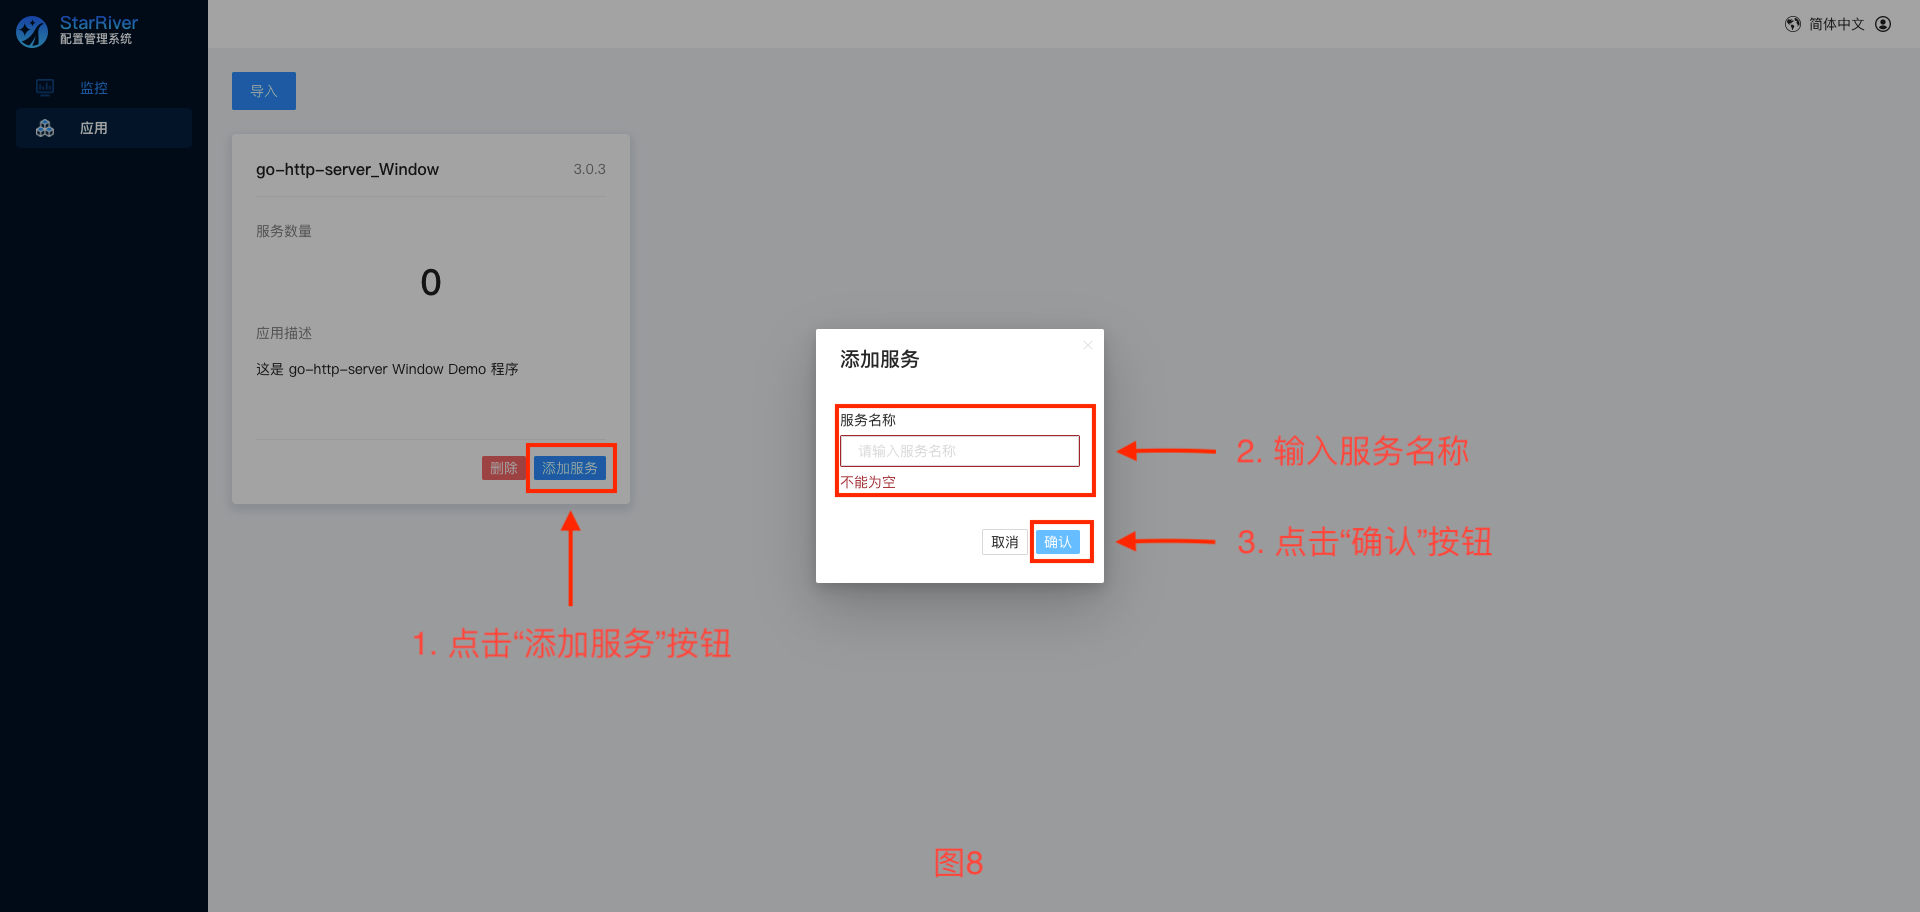
In the application module, add the "Add Service" button in the lower right corner of each application, enter the service name according to the bomb box prompt, and click to confirm the addition of the monitoring object as shown in Figure 8 below.
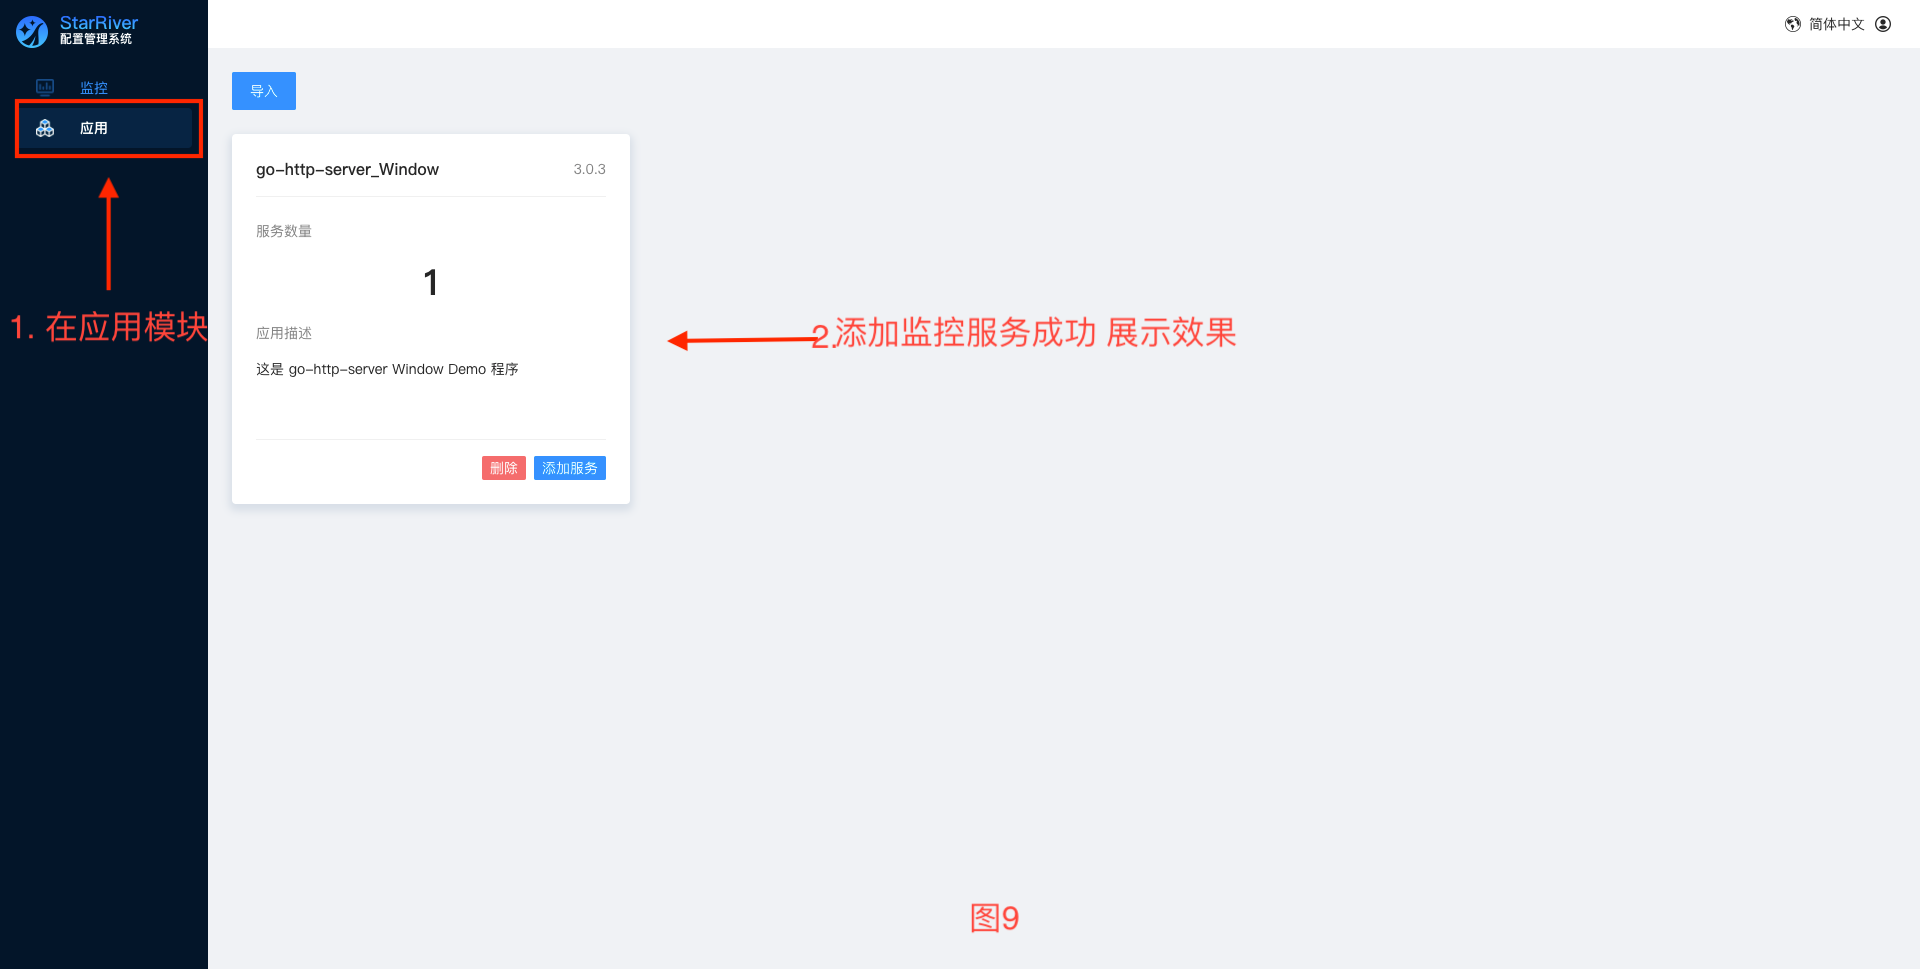
After the successful monitoring object is successful, the Applications module will show the number of monitoring services added to the application, as shown in Figure 9 below.
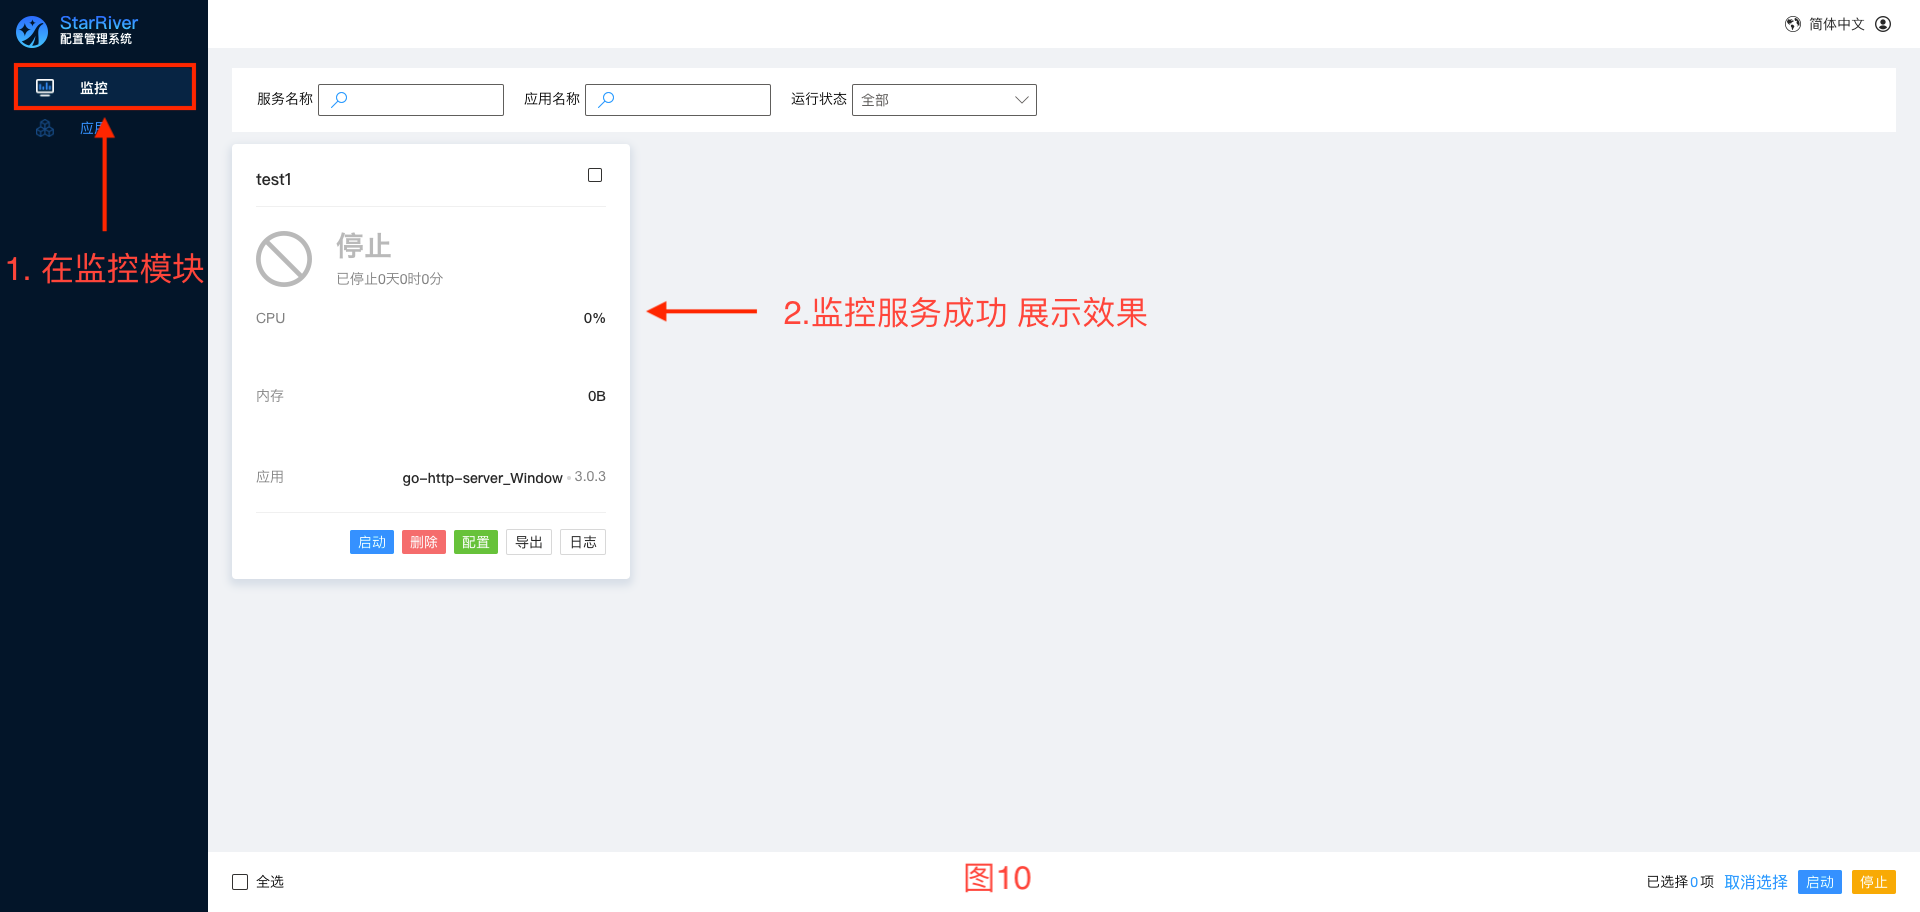
After the successful monitoring object is successful, the Monitoring module will display the additional monitoring service object, including the service name, operating status, CPU usage, memory usage, application, start/stop, deletion, configuration, export, log and other operations as shown in Figure 10 below.
4. Manage the Services
1. Start/stop, delete and configuration of monitoring objects
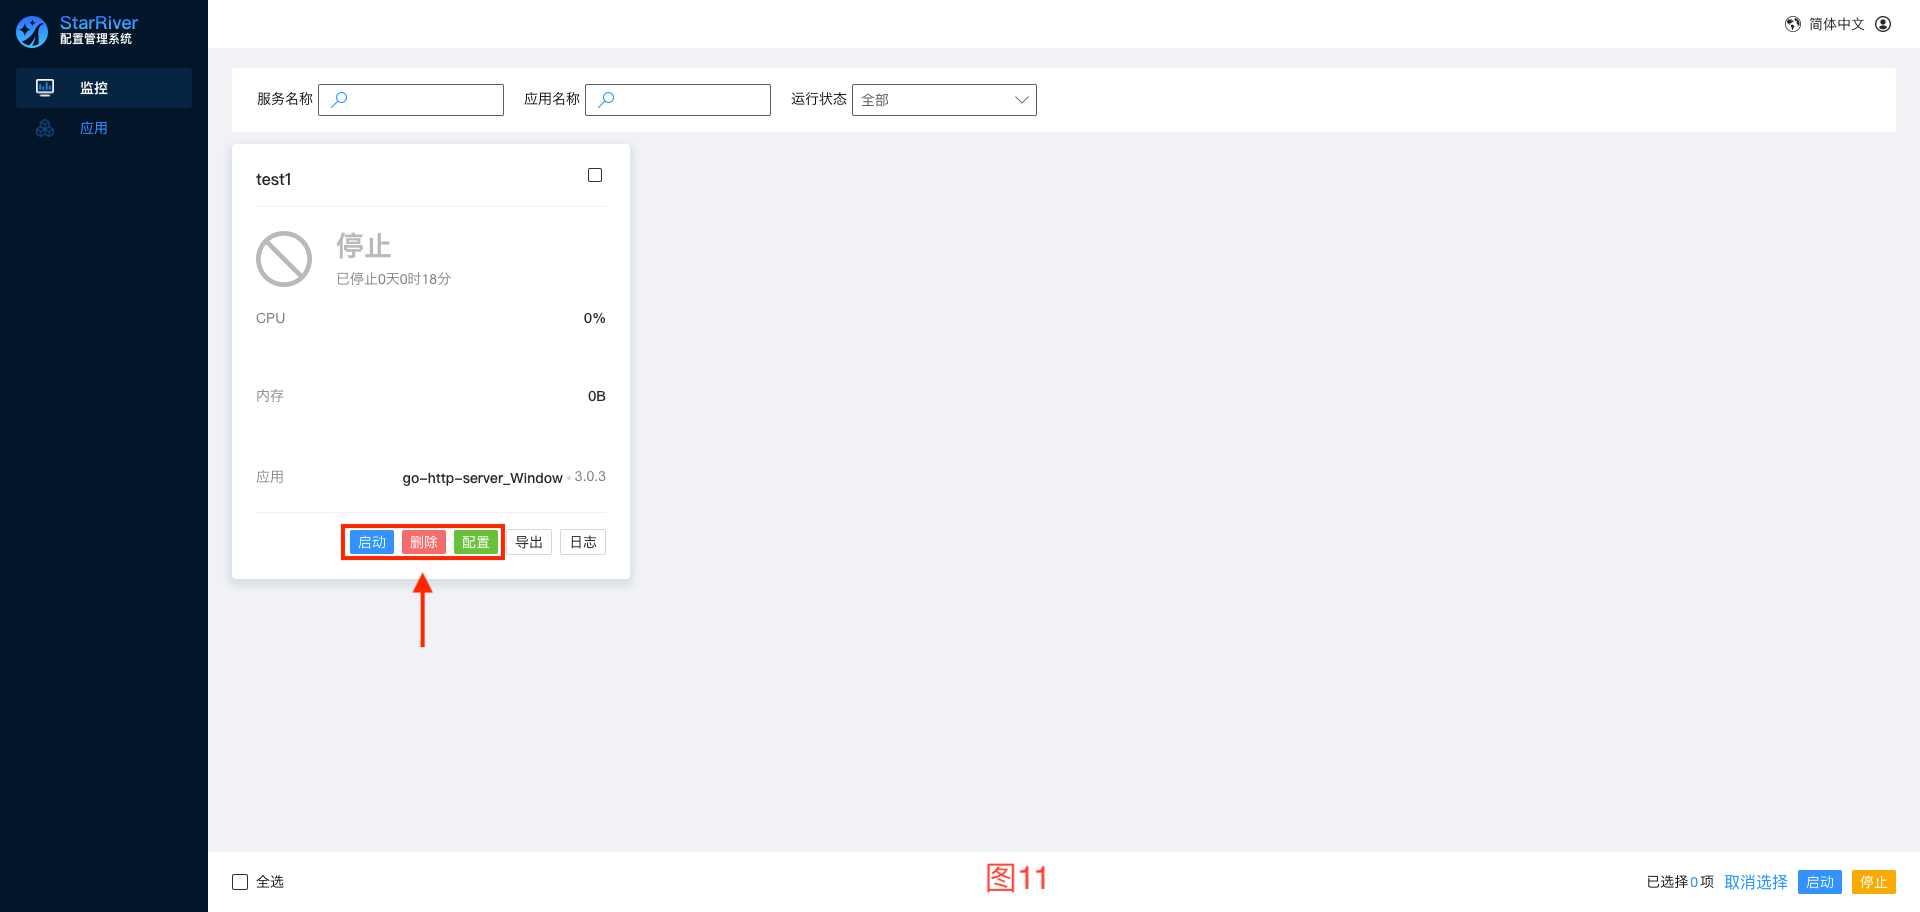
Users can start, stop, delete, configure, etc. each monitoring object can be performed. Just click the corresponding button below each monitoring object, as shown in Figure 11 below.
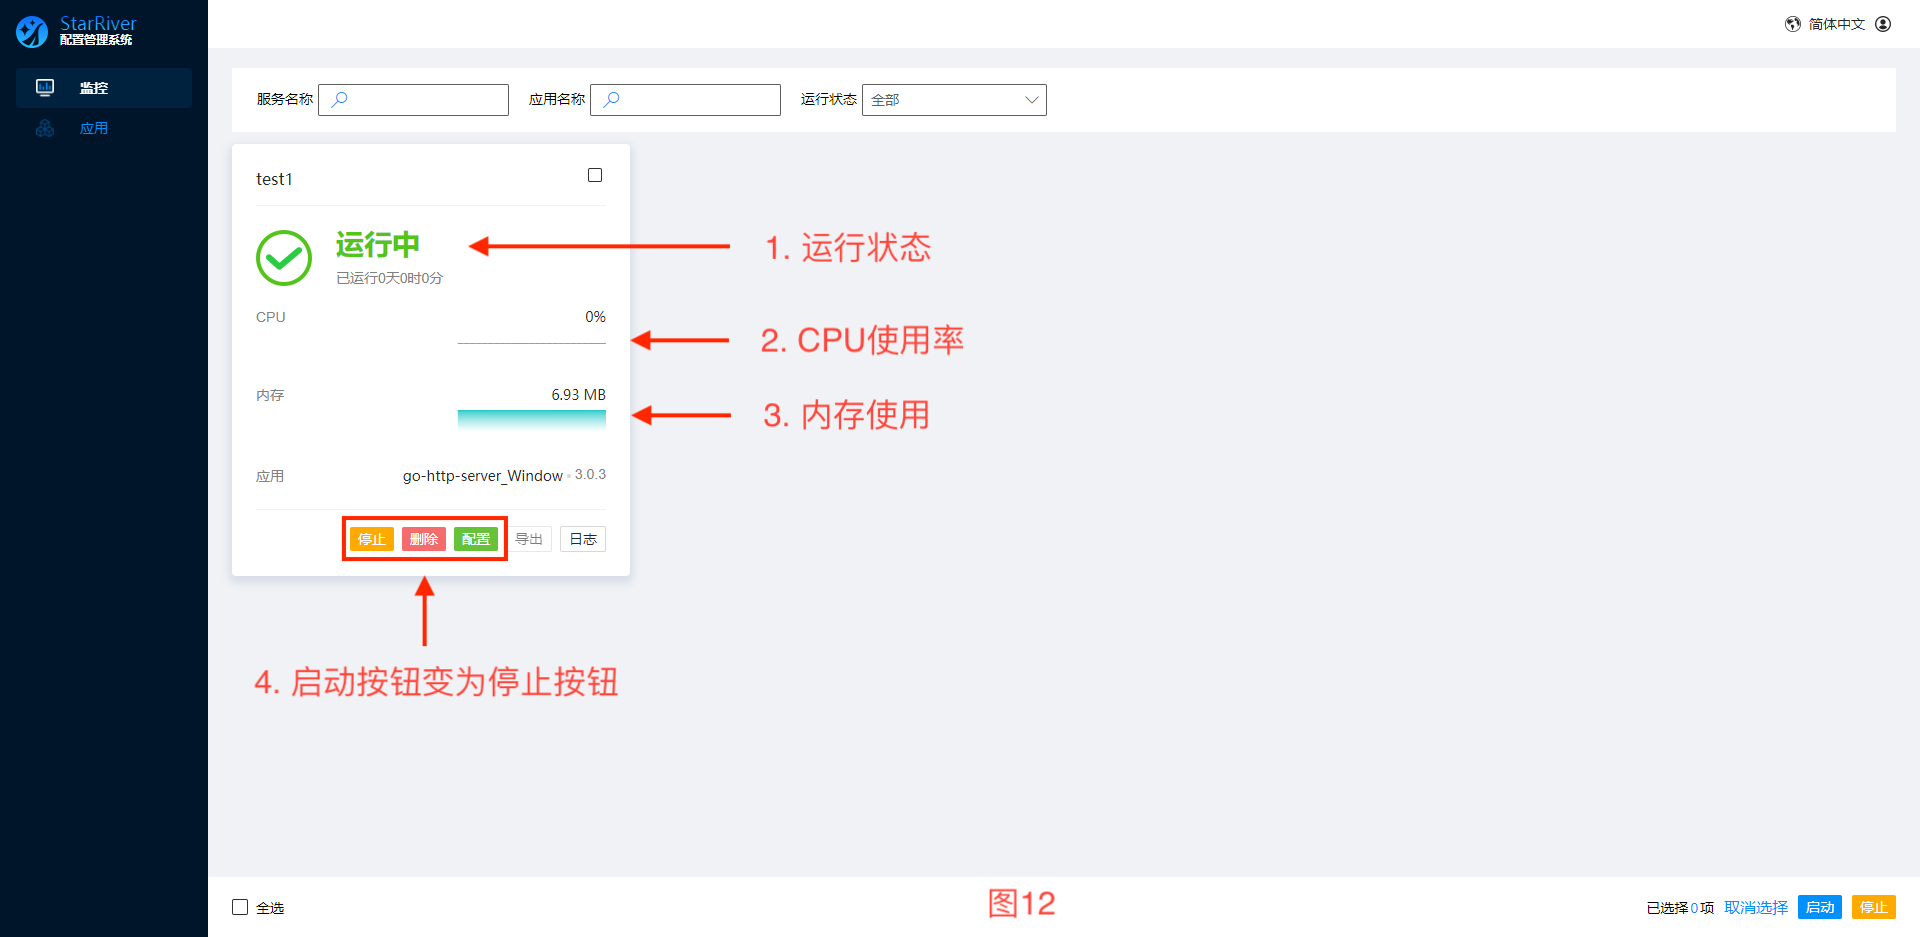
Click the "Start" button after the start is successful, the current operating status of the monitoring object, CPU usage, memory usage, the effect is shown in Figure 12 below.
Note: The running status of the monitoring object includes: stopped, running and error.
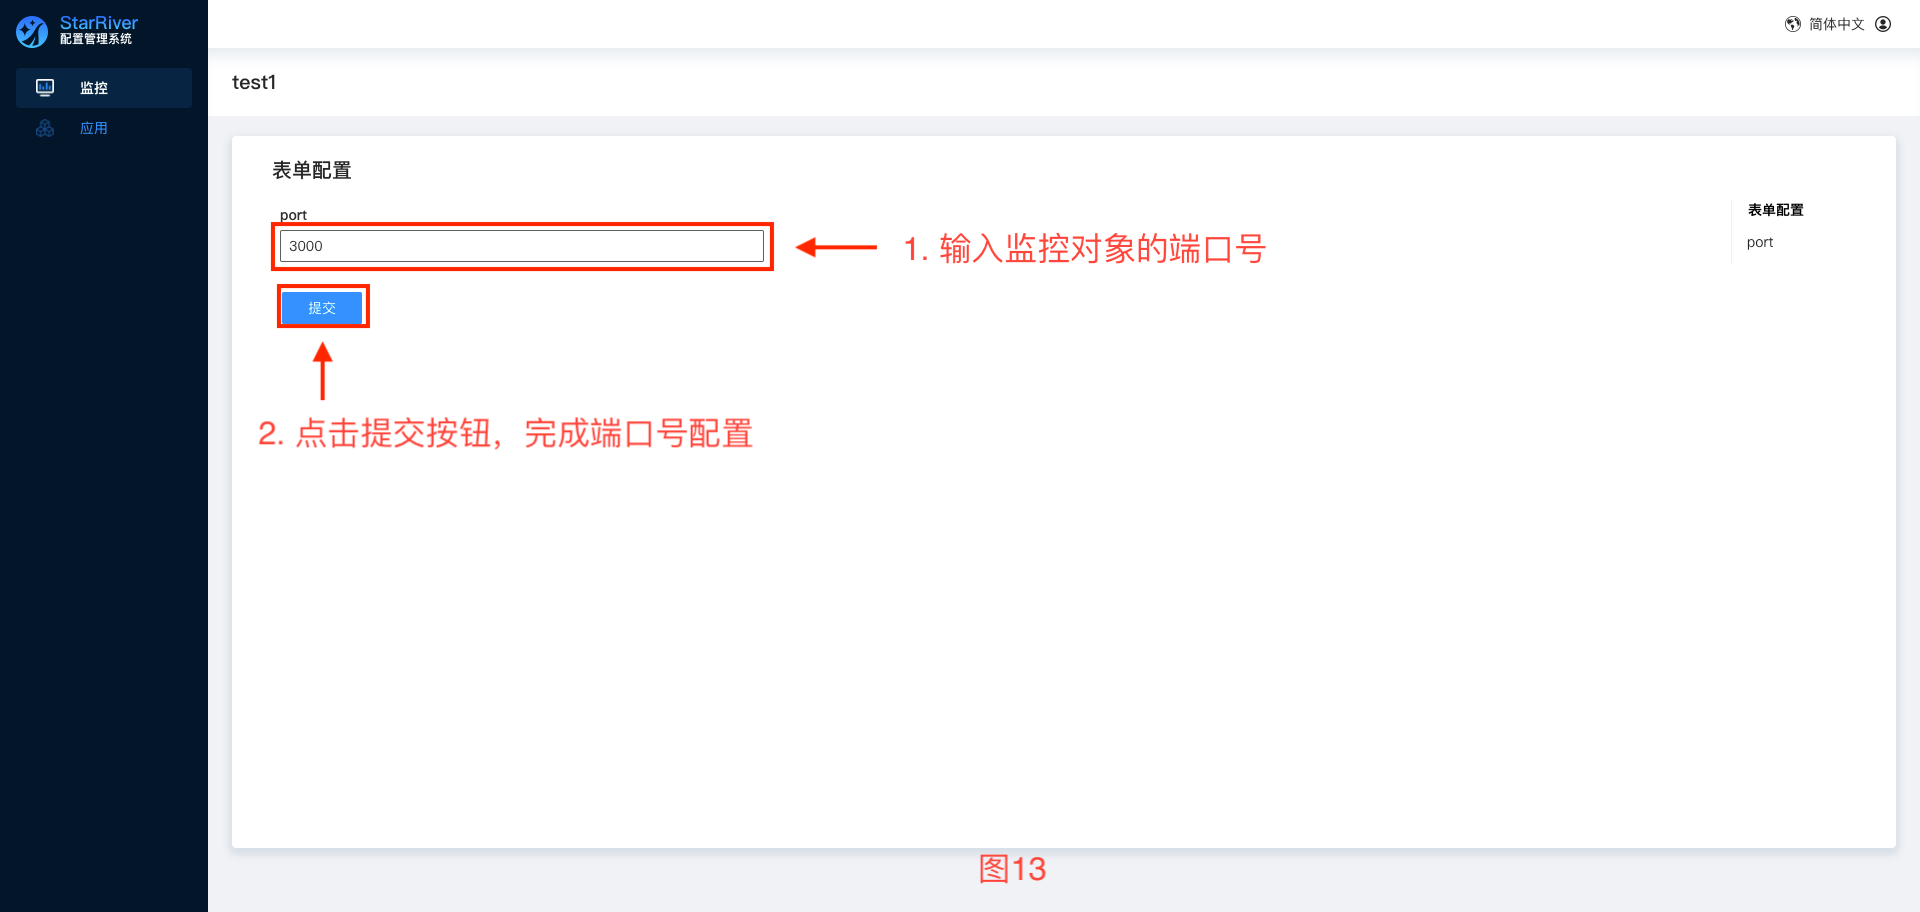
Click the "Configuration" button to enter the configuration page of the monitoring object port. You can configure the slogan of the monitoring object, as shown in Figure 13 below.
2. Configuration and log export
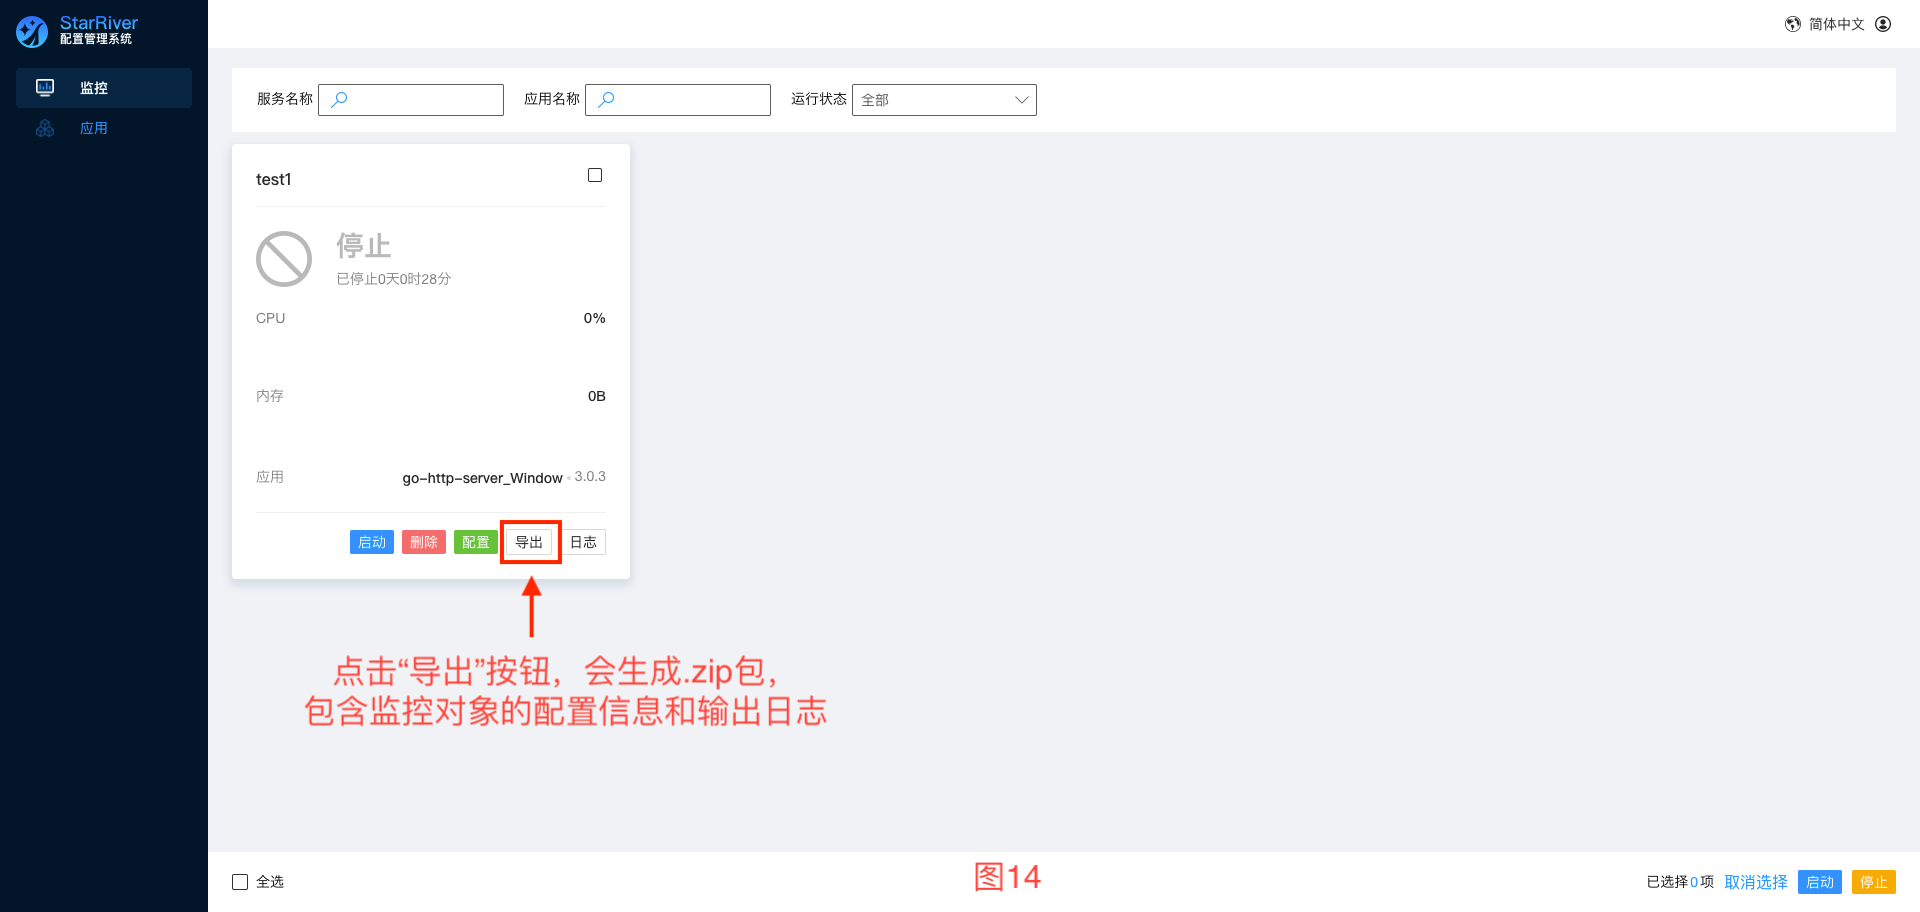
Click the "Export" button to automatically generate ann download test1.zip. The compressed file contains the configuration information file config.json and the logs in stdout.log.
3. Logs view
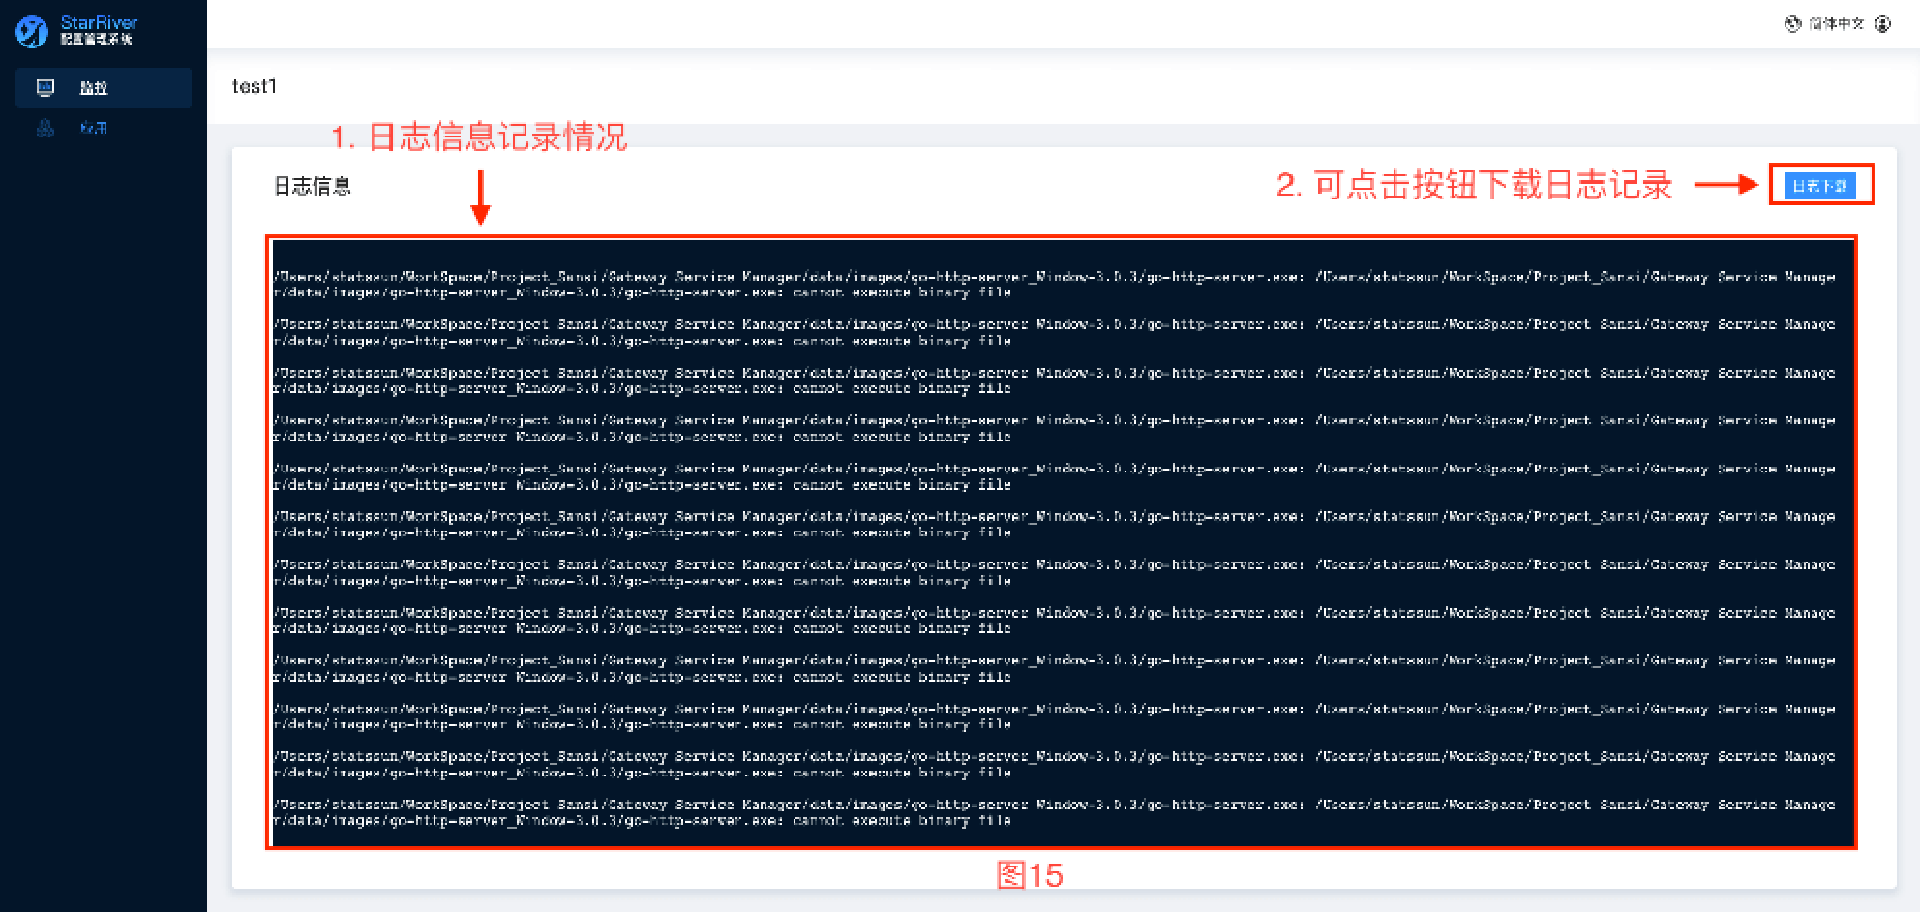
Click the "Log" button to enter the log information display page. Users can view log output records and download logs on this page to facilitate the reason when making errors. As shown in Figure 15 below, the records are errors during test1 startup.
4. Searching
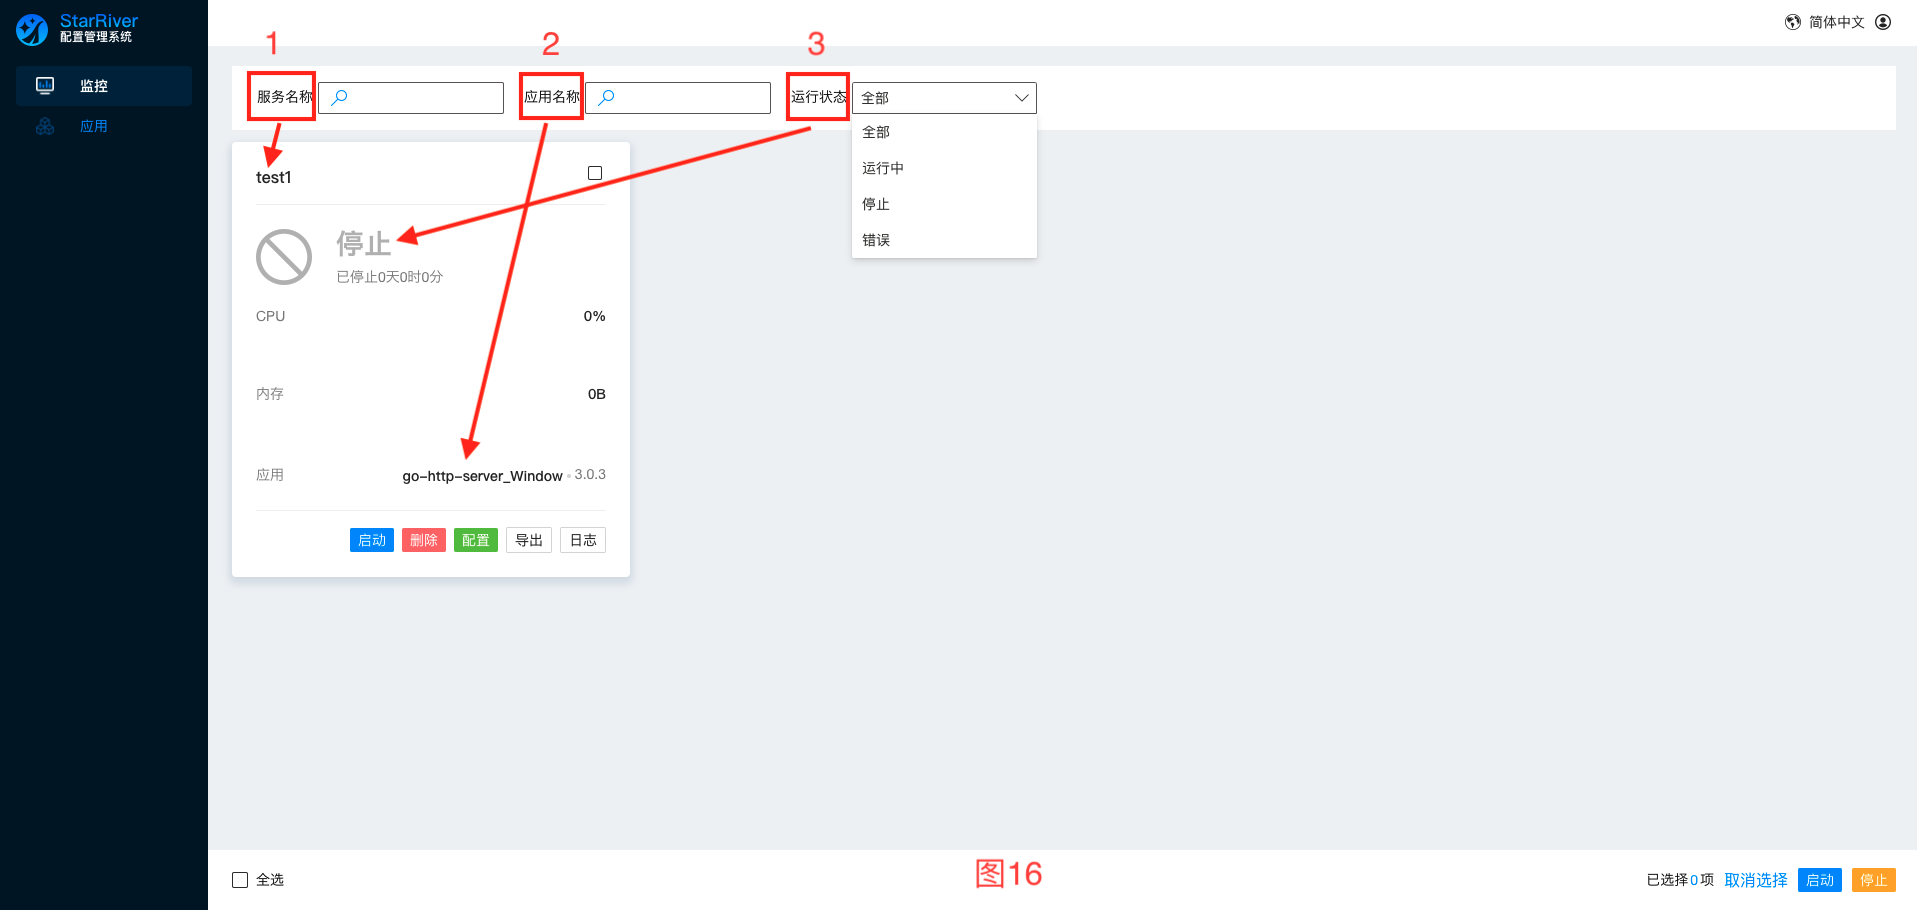
In the monitoring module, you can search for the service name, application name, and running status to quickly find the monitoring objects as shown in Figure 16 below.
Note: The running status filters include: all (default), running, stopped, and error.
5. Batch start/stop
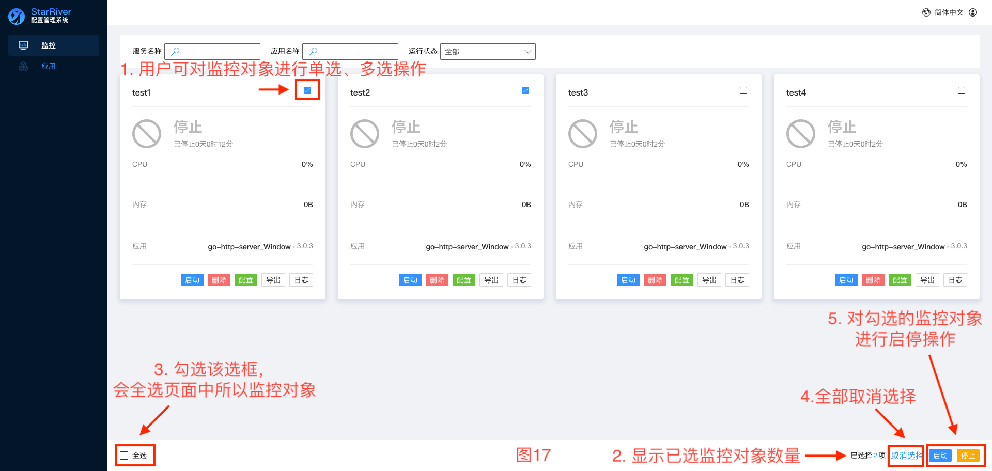
- Users can choose single or multiple monitoring objects, and perform batch startup or stop operations. Refer to marks #1 and #5 in Figure 17 below.
- Users can select all objects with one click to batch start or stop. Refer to mark #3 in Figure 17 below.
- Users can deselect everything with one click. Refer to mark #4 in Figure 17 below.
5. Switch Languages
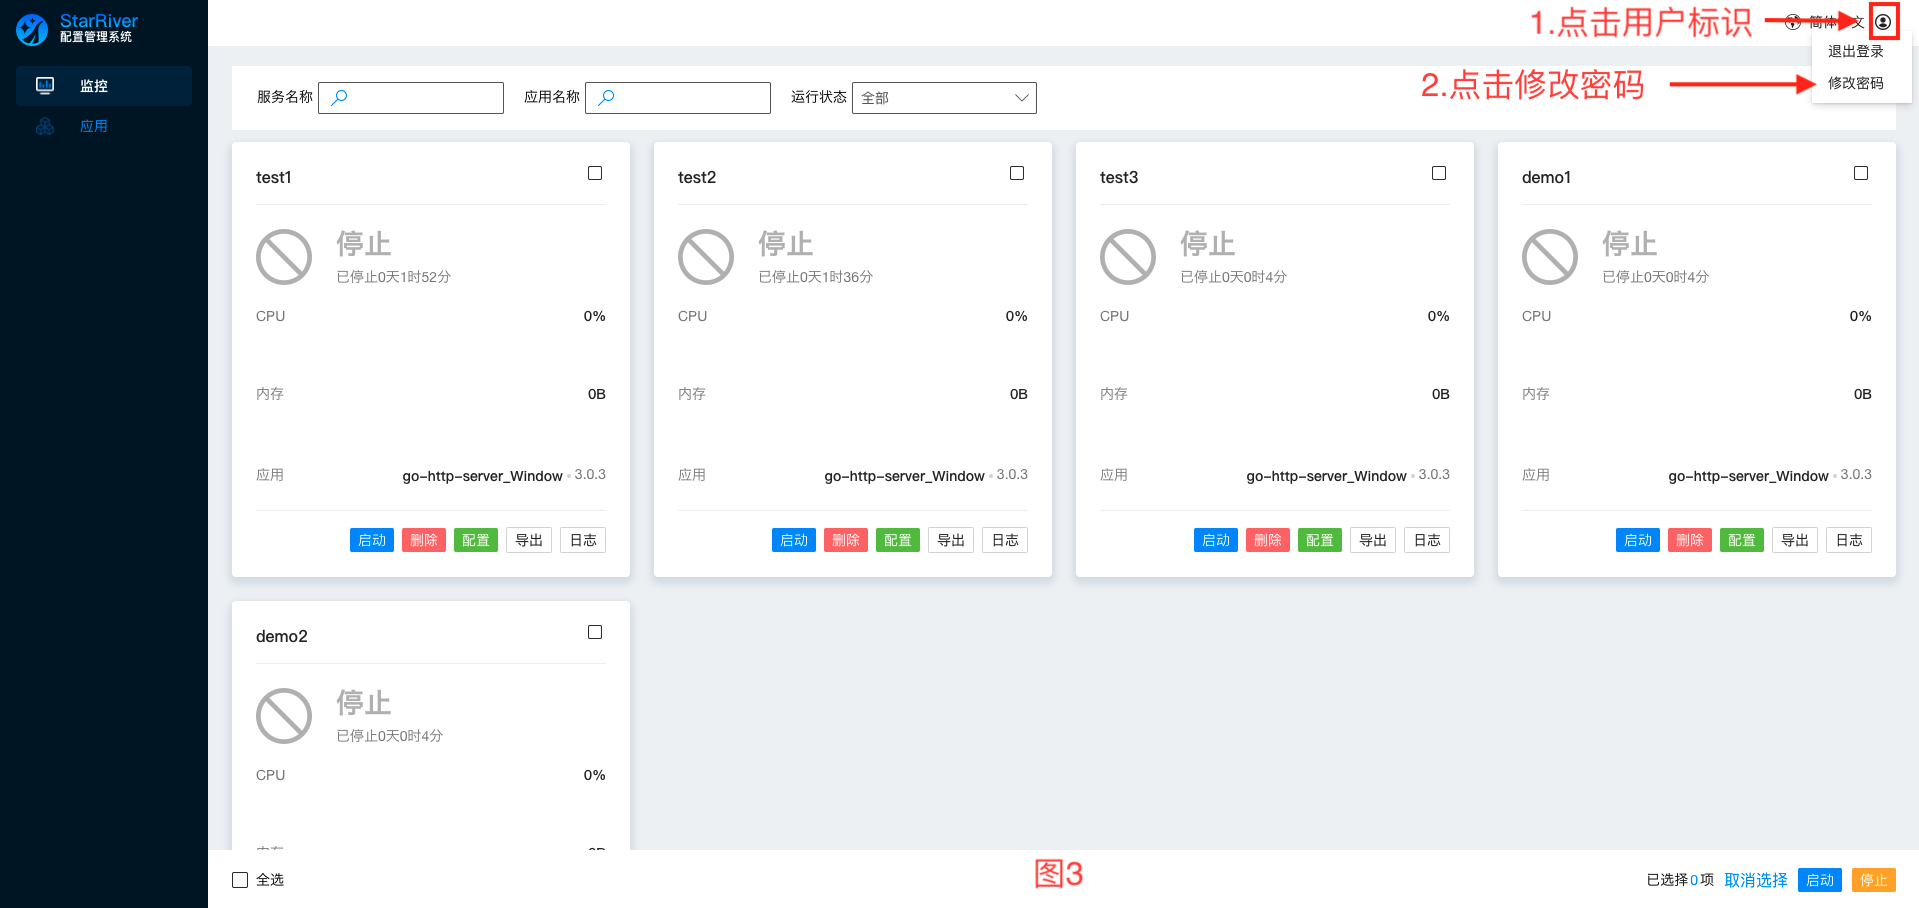
After the user login is successful, click the spherical icon in the upper right corner to select the required display language. Simplified Chinese, English and Arabic are currently supported as shown in Figure 18 below.