Lighting Energy Consumption
1. Overview
Lighting Energy Consumption is a powerful tool designed to help users track and analyze the energy consumption of specific lighting fixtures within a defined time range. Users can customize the statistics based on their needs, such as selecting the time period, aggregation period, and comparing with other time ranges.
This module provides a user-friendly interface that allows users to quickly view and analyze the energy consumption of lighting terminals within a defined time range. Users can customize the statistics based on their needs, such as selecting the time period, aggregation period, and comparing with other time ranges.
2. Function Introduction
2.1 Statistical Criteria

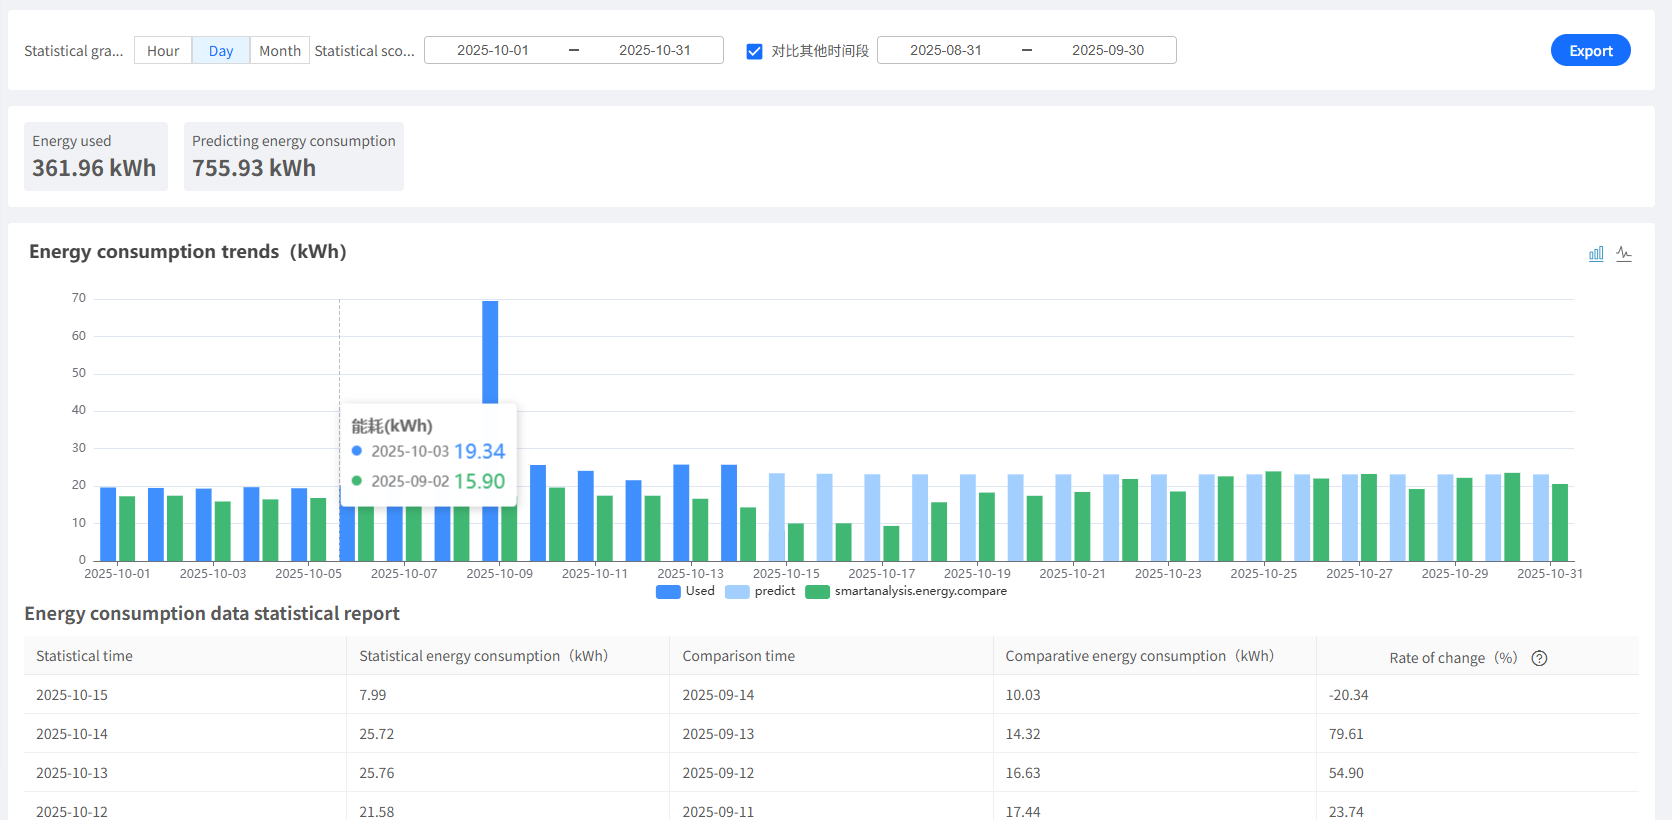
This section is used to select criteria such as statistical granularity and statistical time range.
- Statistical Granularity: Users can select the granularity for data statistics:
- Hourly: One data entry per hour; data within a maximum of 14 days can be selected.
- Daily: One data entry per day; data within a maximum of 6 months can be selected.
- Monthly: One data entry per month; data within a maximum of 3 years can be selected.
- Statistical Range: Users can select the time range for the statistical data.
- Support for Comparison with Other Time Periods
The comparison time range will be automatically aligned with the statistical time range. Users only need to change the start or end time, and the other time (end or start time of the comparison range) will be calculated automatically—no manual setting is required.
2.2 Energy Consumption Overview
This section displays the overall energy consumption data under the current filter criteria.
- Energy Used: Shows the total energy consumption within the selected time period, with the unit of kWh.
- Predicting energy consumption: The estimated energy consumption value calculated by the system based on historical data models, used for trend prediction, with the unit of kWh.

2.3 Energy Consumption Trend Chart
This section displays the energy consumption trend graph for the lighting terminals within the specified time period. The graph includes both the actual energy consumption (used energy) and the predicted energy consumption (forecasted energy). Users can also add other time range energy consumption data for comparison.
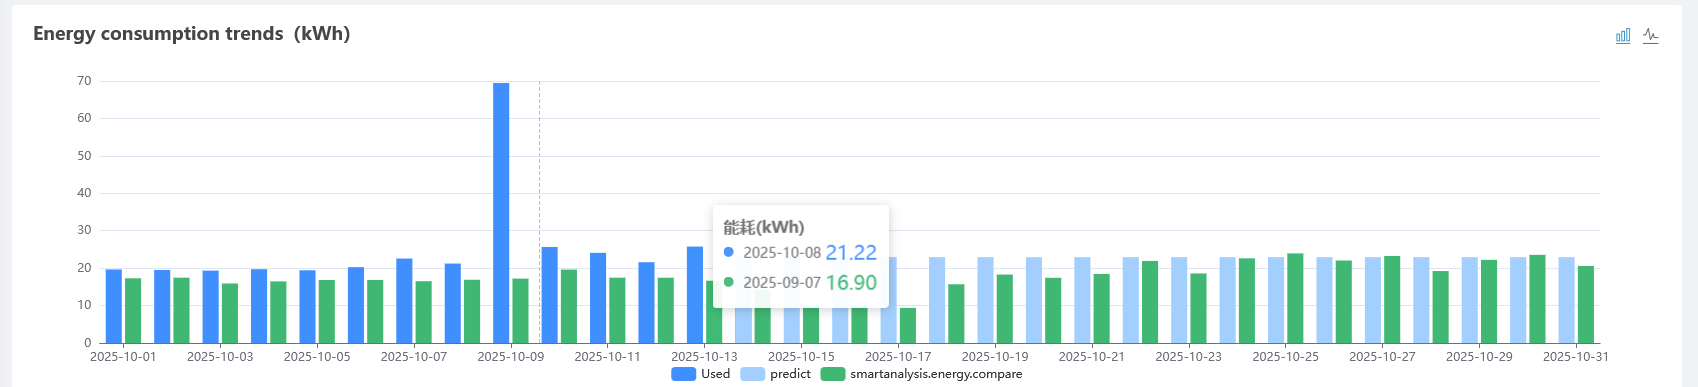
Bar Chart
This chart displays the energy consumption data for the lighting terminals within the specified time period. Each bar represents the energy consumption for a specific time period (hour, day, or month), with the height of the bar indicating the energy consumption value in kWh.
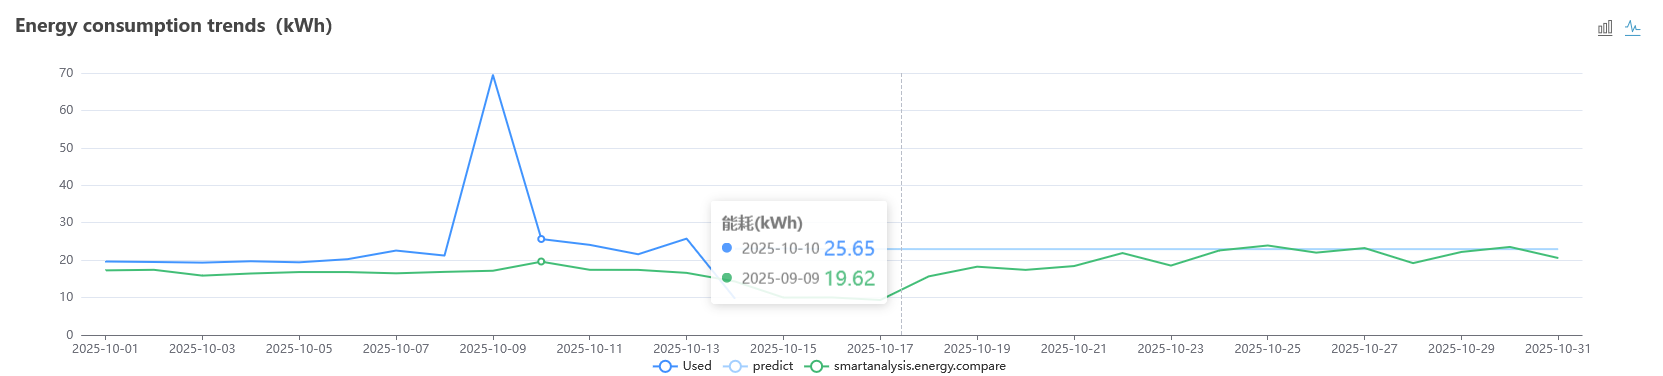
Line Chart
This chart displays the energy consumption data for the lighting terminals within the specified time period. Each line represents the energy consumption for a specific time period (hour, day, or month), with the y-axis indicating the energy consumption value in kWh.
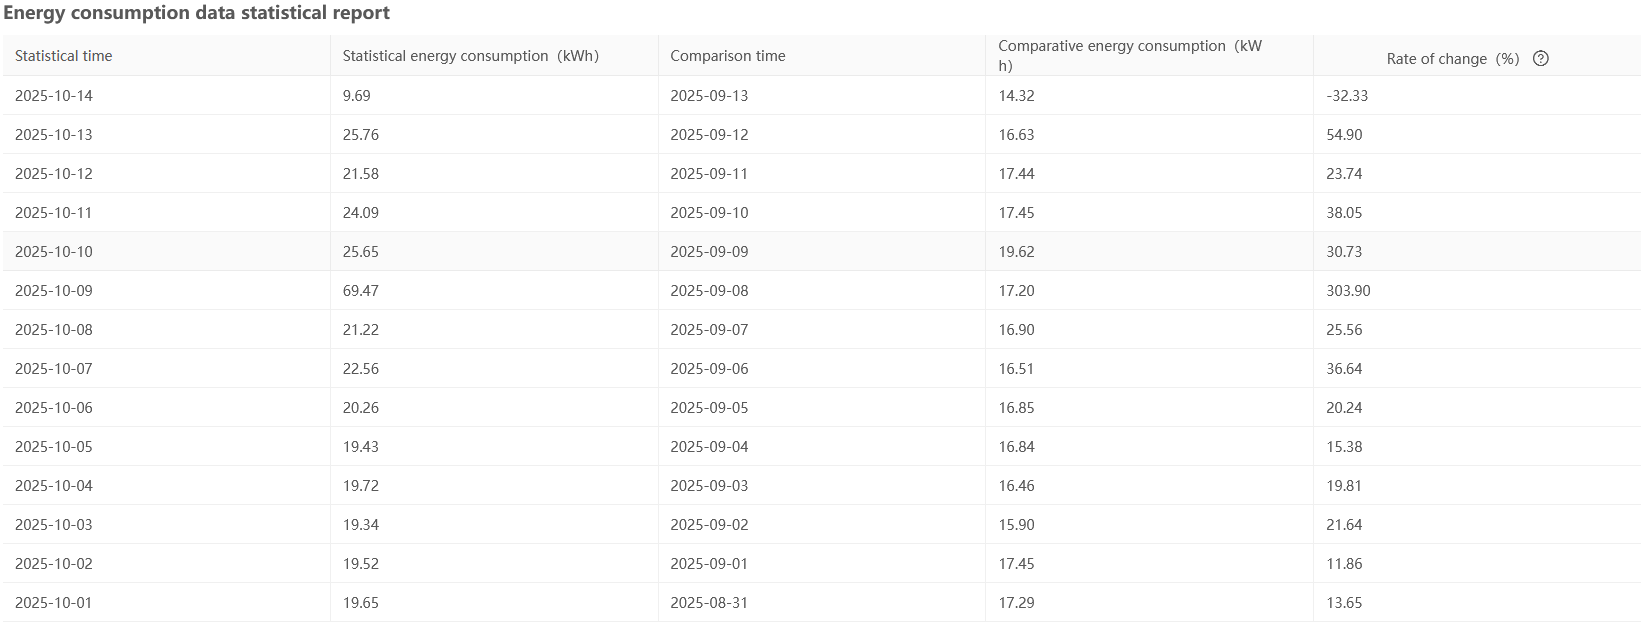
2.4 Statistical Report
This section displays the statistical data for the lighting terminals within the specified time period. The data is presented in a tabular format, including columns for date, used energy consumption, and compared energy consumption (if any).
2.5 Data Export Function
Export Report: Users can export the energy consumption data to a CSV file for further analysis and record-keeping.
3. Operation Steps
3.1 Viewing Energy Consumption Data
- After logging into the system, select the
Smart Analysismodule from the system menu to enter. - In the left-side menu, click
Statistical Reportsto navigate to the report category page. - On the report category page, select
Lighting Energy Consumptionto access the report details page.
3.2 Selecting Report Query Criteria
- After logging into the system, select the Smart Analysis module from the system menu to enter.
- In the left-side menu, click Statistical Reports to navigate to the report category page.
- On the report category page, select Lighting Energy Consumption to access the report details page.
- On the report details page, select the statistical granularity (Hourly, Daily, Monthly) for viewing report data. The default granularity is Daily.
- On the report details page, select the time range for viewing.
- Optionally, select whether to compare energy consumption data with other time periods (as needed).


3.2 Exporting Energy Consumption Data
- After logging into the system, select the Smart Analysis module from the system menu to enter.
- In the left-side menu, click Statistical Reports to navigate to the report category page.
- On the report category page, select Lighting Energy Consumption to access the report details page.
- Select the viewing parameters for the report data (e.g., statistical granularity, time range, as specified in Section 3.3).
- Click the "Export" button above the chart.
- Save the file to your local device.
3.4 Chart Switching
- After logging into the system, select the Smart Analysis module from the system menu to enter.
- In the left-side menu, click Statistical Reports to navigate to the report category page.
- On the report category page, select Lighting Energy Consumption to access the report details page.
- Above the chart, click either the
 or
or  button to switch the chart display style.
3.6 Querying Data Under Different Domains
- After logging into the system, select the Smart Analysis module from the system menu to enter.
- In the left-side menu, click Statistical Reports to navigate to the report category page.
- On the report category page, select Lighting Energy Consumption to access the report details page.
- Locate the "Domain" switch menu at the top of the page, select a different domain, and the chart will automatically update to display the lighting terminals energy consumption data corresponding to the selected domain.
4. Report Interpretation
4.1 Chart Interpretation
- X-axis: Represents time (e.g., from February 1, 2025, to February 28, 2025).
- Y-axis: Represents energy consumption, with the unit of kWh (kilowatt-hour).
- Blue Bar/Line: Indicates the used energy consumption per unit under the current statistical dimension (Hourly, Daily, Monthly).
- Light Blue Bar/Line: Indicates the projected energy consumption per unit under the statistical dimension (Daily, Monthly).
- Green Bar/Line: Indicates the used energy consumption under the comparison time range (if applicable).
4.2 Data Overview Interpretation
- Used Energy Consumption: For example, "337.33 kWh" represents the total energy consumption within the specified time range.
- Projected Energy Consumption: For example, "750.44 kWh" represents the sum of the total energy consumption that has occurred within the currently specified time and the projected energy consumption for the remaining future period within the specified time range.
- Projected energy consumption is calculated based on historical data from a recent period. The accuracy of the projection depends on the accuracy of the historical data and the prediction model. The content here is for reference only.
- For the system’s usage scenarios, projection of data under the Hourly statistical dimension is not supported.
5. Additional Notes
- The system backend automatically performs energy consumption statistics for the electric meters configured in the system, and no specific configuration is required.
- The statistical standard for daily data depends on the relevant settings of Data Statistical Time in the system configuration.